
Figure 5. Inflammation predominates the response to A20 and ABIN1 overexpression in the context of cytokine stimulation.
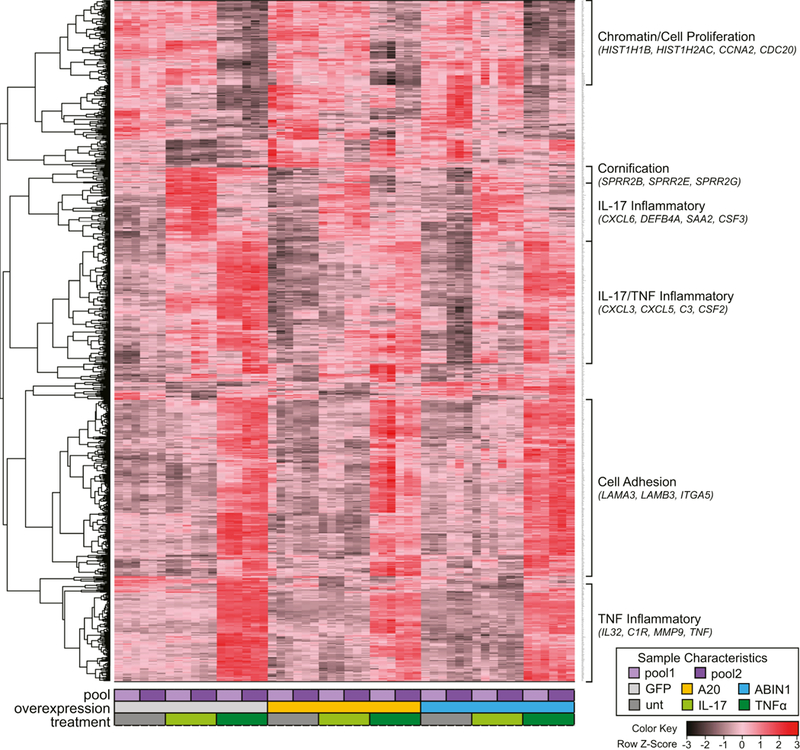
Unsupervised hierarchical clustering dendrogram and heatmap of gene RNA expression values. Each column represents RNA-seq CPM values for one of six replicates (3 replicates each for 2 pooled keratinocyte isolates) for 9 different treatment conditions (GFP expressing (negative control), A20 overexpressing, or ABIN1 overexpressing keratinocytes, with and without 24 hours of IL-17A or TNFα stimulation). Each row represents one of the 861 differentially expressed genes with FDR < 1 ×10⁻⁵. The color key represents for each row, deviation from the mean in standard deviations.