
Figure 1.
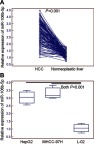
Expression levels of miR-106b-5p in HCC tissues and cells detected by quantitative PCR assay. (A) Expression levels of miR-106b-5p in HCC tissues were significantly higher than those in the adjacent nonneoplastic liver tissues (mean ± S.D.: 2.89±0.80 vs 1.23±0.22, P<0.001). (B) Expression levels of miR-106b-5p in HCC cell lines were significantly higher than those in normal liver cell line (HepG2 vs L-02, mean ± S.D.: 3.04±0.47 vs 1.06±0.31, P<0.001; MHCC-97H vs L-02, mean ± S.D.: 3.33±0.44 vs 1.06±0.31, P<0.001).