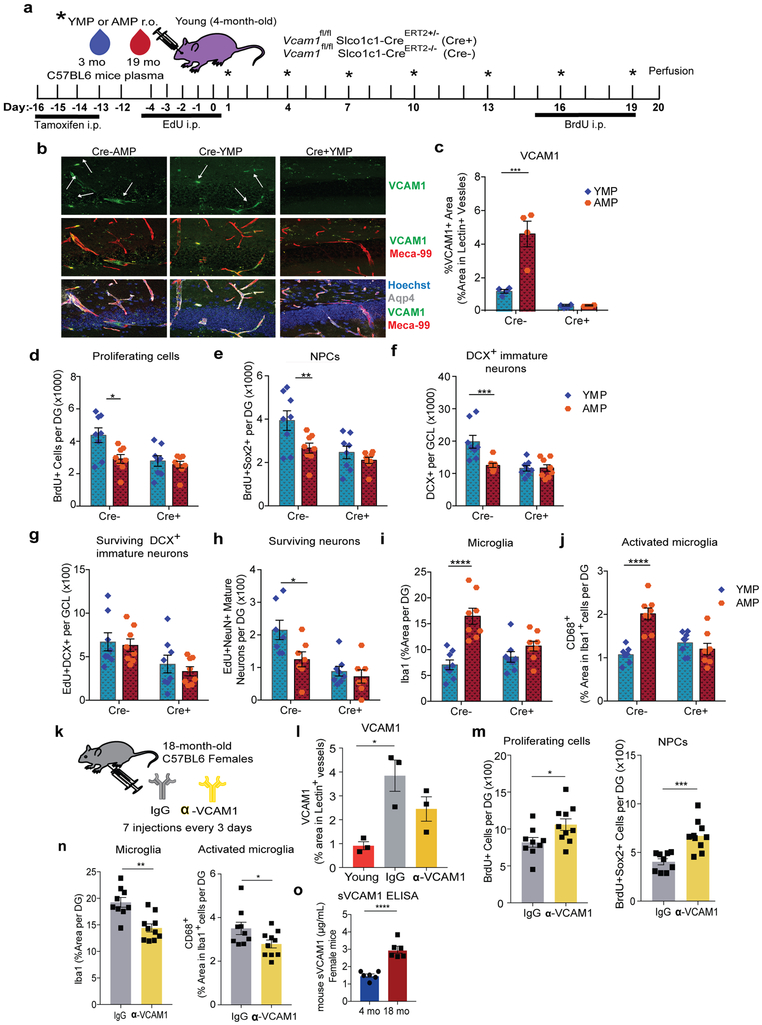
Extended Data Figure 5. Brain endothelial and epithelial-specific Vcam1 deletion in young mice mitigates the negative effects of aged plasma administration and anti-VCAM1 antibody reduces hallmarks of brain aging in female mice.
(a) Experimental Design. n=8 mice per group.
(b) Representative confocal images and (c) quantification in the DG of VCAM1, MECA-99, and Aqp4. Hoechst labels cell nuclei. Scale bar = 100 μm. Arrows point to VCAM1+ vessels. (n=4 mice/group analyzed). 2-way ANOVA with Tukey’s multiple comparisons test. Mean +/− SEM.***p=0.0002.
(d-f) Quantification of the total number of BrdU+ cells, BrdU+Sox2+ neural progenitor cells, and DCX+ immature neurons in the DG of immunostained sections. n=8 mice per group. 2-way ANOVA with Tukey’s multiple comparisons test. Mean +/− SEM. *p=0.0193, **p=0.0283, ***p=0.0015.
(g-h) Quantification of the total number of surviving EdU+DCX+ immature neurons and EdU+NeuN+ neurons in the DG of immunostained sections. n=8 mice per group. 2-way ANOVA with Tukey’s multiple comparisons test. Mean +/− SEM. *p=0.0181.
(i-j) Quantification of Iba1 and CD68 in the DG of immunostained sections. n=8 mice per group. 2-way ANOVA with Tukey’s post-hoc test. Mean +/− SEM.****p<0.0001 for both.
(k) Schematic. Aged (18-month-old) C57BL6/J female mice received i.p. injections of a mouse specific anti-VCAM1 mAb or IgG isotype control (9 mg/kg) every 3 days for a total of 7 injections. Mice also received BrdU daily (100 mg/kg i.p.) for 6 consecutive days followed by perfusion 2 days after the last injection. n=9 IgG- treated and 10 anti-VCAM1 mAb-treated mice per group.
(l) Quantification of VCAM1+Lectin+ staining from confocal images in the DG. n=3 mice brain sections stained and quantified per group. Mean +/− SEM. *p=0.0128, 1-way ANOVA with Tukey’s multiple comparisons post-hoc test.
(m) Quantification of BrdU+ and BrdU+Sox2+ staining from confocal images in the DG. n=9 IgG- treated and 10 anti-VCAM1 mAb-treated mice per group. Unpaired two-tailed Student’s t-test. Mean +/− SEM. *p=0.0325, ***p=0.0003.
(n) Quantification of Iba1 and CD68 staining from confocal images in the DG. n=9 IgG- treated and 10 anti-VCAM1 mAb-treated mice per group. **p=0.0008, *p= 0.0427. Unpaired two-tailed Student’s t-test. Mean +/− SEM.
(o) sVCAM1 ELISA of the plasma of young (4-month-old) and aged (18-month-old) female mice. n=6 mice/group. ****p<0.0001. Unpaird two-tailed Student’s t-test. Mean +/− SEM.

