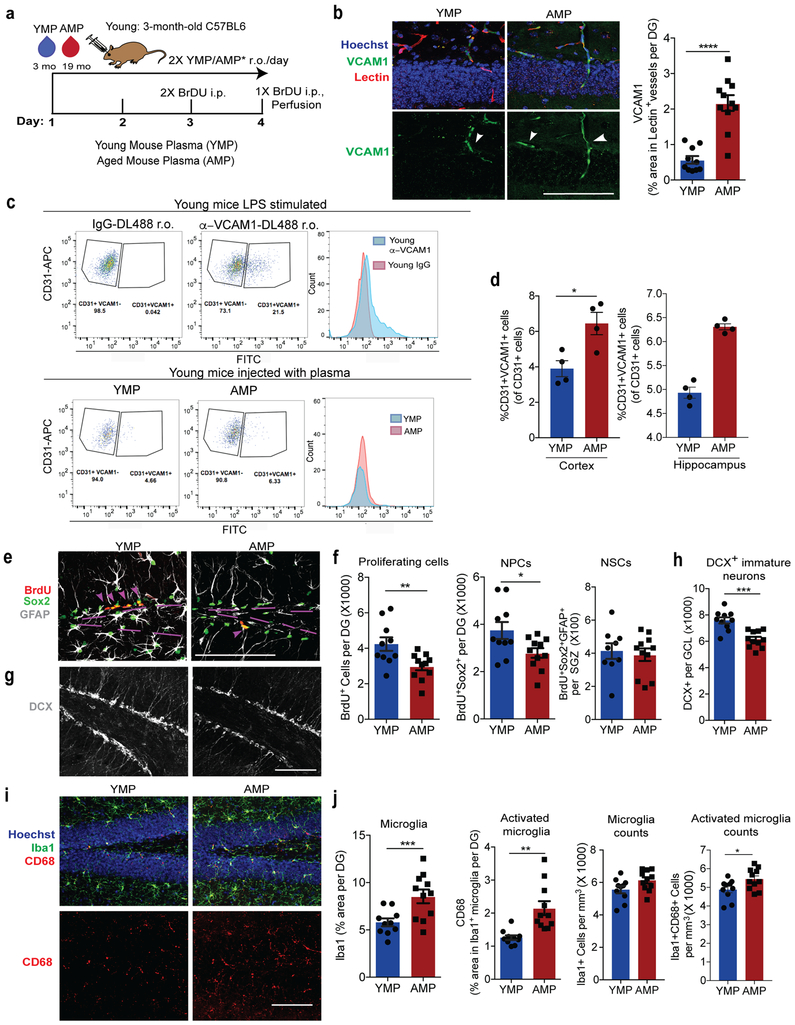
Fig. 3. Aged blood administration into young mice activates brain vasculature and microglia and reduces hippocampal NPC activity.
(a) Schematic of experimental design. n=10 mice treated with YMP,11 mice treated with AMP.
(b) Representative confocal images (left) and quantification (right) of VCAM1+lectin+ in the DG. Hoechst labels cell nuclei. Arrows indicate VCAM1+ vessels. Scale bar = 100 µm. ****p=0.0001. Two-tailed Student’s t-test. Mean +/− SEM. n=10 mice treated with YMP,11 mice treated with AMP.
(c) Top: Histogram plots of CD31+VCAM1+ cells isolated from LPS stimulated young (3-month-old) wildtype mice injected (r.o.) with fluorescently tagged DL488 anti-VCAM1 mAb or IgG-DL488 isotype control 2 hours before sacrifice. This was done to set the gating for VCAM1+CD31+BECs. Bottom: Flow gating and histogram plots of pooled (n=4 mice/plasma treatment), young hippocampi isolated from plasma-injected young mice. To label VCAM1+BECs, mice were injected (r.o.) with fluorescently tagged DL488 anti-VCAM1 mAb 2 hours before sacrifice.
(d) Quantification of CD31+VCAM1+cells isolated from (left) healthy cortex (n=4 mice per plasma treatment, individually measured) and (right) 4 technical replicates of hippocampi that are pooled from 4 mice per plasma treatment group. Mean +/− SEM. *p=0.017. Two-tailed Student’s t-test.
(e) Representative confocal images and quantification (f) in the DG and SGZ of BrdU+, Sox2+, and GFAP. Scale bar = 100 µm. Purple lines outline the SGZ and arrows indicate proliferating NPCs. **p=0.009, *p=0.028. Two-tailed Student’s t-test. Mean +/− SEM. n=10 mice treated with YMP,11 mice treated with AMP.
(g) Representative confocal images and quantification (h) in the GCL of DCX (white). Scale bar = 100 µm. ***p=0.0001. Two-tailed Student’s t-test. Mean +/− SEM. n=10 mice treated with YMP,11 mice treated with AMP.
(i) Representative confocal images and quantification (j) in the DG of CD68, Iba1, and Hoechst. Scale bar = 100 µm. ***p=0.0047, **p=0.0011, *p=0.031. Two-tailed Student’s t-test. Mean +/− SEM. n=10 mice treated with YMP,11 mice treated with AMP.

