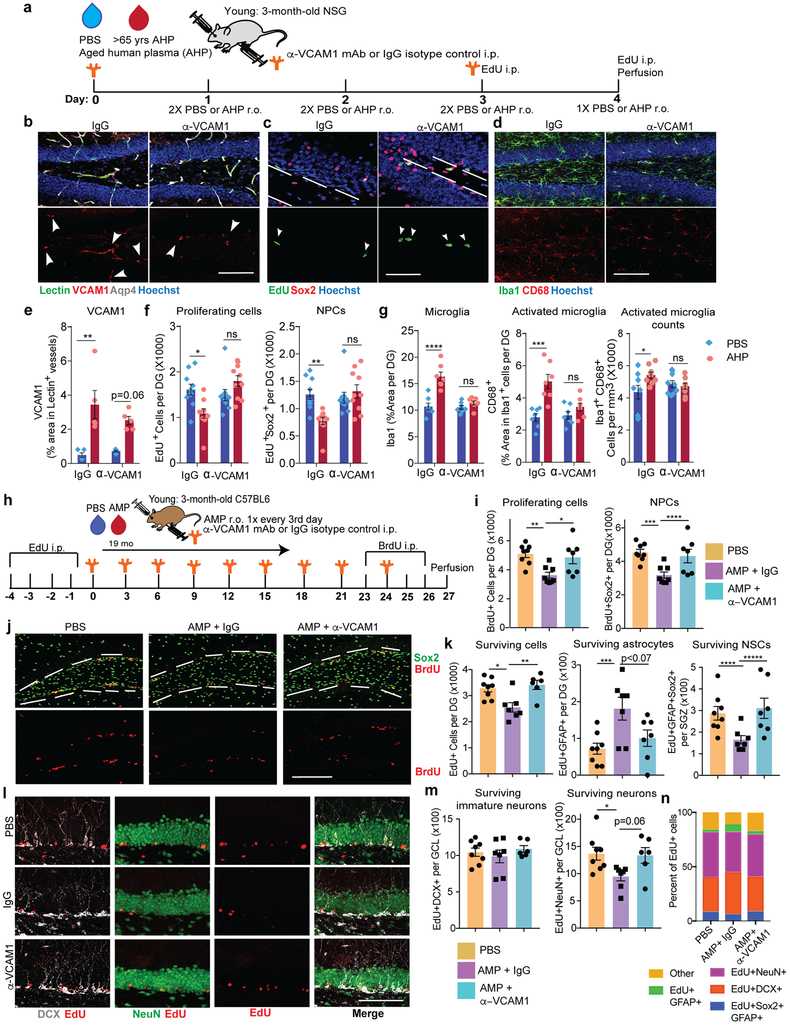
Fig. 5. Anti-VCAM1 antibody prevents inhibitory effects of aged plasma administration in young mice.
(a) Experimental design. n=10 mice per group.
(b) Representative confocal images and quantification (e) (n= 5 mice/group) in the DG of VCAM1, lectin, and Aqp4. Hoechst labels cell nuclei. White arrows point to VCAM1+ vessels. Scale bar = 100 µm. Mean +/− SEM. 2-way ANOVA with Tukey’s multiple comparisons test. ****p=0.0013, p=0.06 (PBS vs. AHP in mice treated with anti-VCAM1 mAb).
(c) Representative confocal images and quantification (f) in the DG of EdU and Sox2. Hoechst labels cell nuclei. Arrows indicate proliferating NPCs. The SGZ is outlined with white lines. Scale bar = 50 µm. n=10 mice/group. Mean +/− SEM. 2-way ANOVA with Tukey’s multiple comparisons test. *p=0.0154.
(d) Representative confocal images and quantification (g) in the DG of CD68 and Iba1. Hoechst labels cell nuclei. Scale bar = 100 µm. n=10 mice/group. Mean +/− SEM. 2-way ANOVA with Tukey’s multiple comparisons test. ****p<0.0001, ***p=0.0001, *p=0.0407.
(h) Experimental design. n=8 mice injected with PBS (r.o.), 8 mice injected with AHP (r.o.) and IgG (i.p.), and 7 mice injected with AHP (r.o.) and anti-VCAM1 mAb (i.p.)
(i) Quantification and (j) representative confocal images in the DG of BrdU+ and BrdU+Sox2+ precursor cells. The SGZ is outlined with white lines. Scale bar = 100 µm. n=8 mice injected with PBS, 8 mice injected with AHP and IgG, and 7 mice injected with AHP and anti-VCAM1 mAb. Mean +/− SEM. One-way ANOVA with Tukey’s post hoc test for group comparisons. **p=0.0056, *p=0.0253, ***p=0.0041, ****p=0.019.
(k) Quantification in the DG of total number of surviving EdU+ cells, EdU+GFAP+ astrocytes, and EdU+Sox2+GFAP+ radial glia-like NSCs in the SGZ based on confocal images of immunostained brain sections for EdU, Sox2, and GFAP. n=8 mice injected with PBS, 8 mice injected with AHP and IgG, and 7 mice injected with AHP and anti-VCAM1 mAb. Mean +/− SEM. One-way ANOVA with Tukey’s post hoc test for group comparisons. **p=0.011, **p=0.0057, ***p=0.0083, ****p=0.049, *****p=0.022.
(l) Representative confocal images and quantification (m) in the GCL of EdU, DCX, and NeuN. Scale bar = 100 µm. n=8 mice injected with PBS, 8 mice injected with AHP and IgG, and 7 mice injected with AHP and anti-VCAM1 mAb. Mean +/− SEM. One-way ANOVA with Tukey’s post hoc test for group comparisons. *p=0.0399 and p=0.0643(AMP+IgG vs. AMP+ anti-VCAM1 mAb).
(n) Cell fate based on co-labeling of surviving EdU+ cells 4 weeks after EdU labeling of mice. Each bar represents 100% of EdU+ cells.

