
Fig. 2. Mean US expectancy ratings during fear acquisition, extinction learning, and extinction recall.
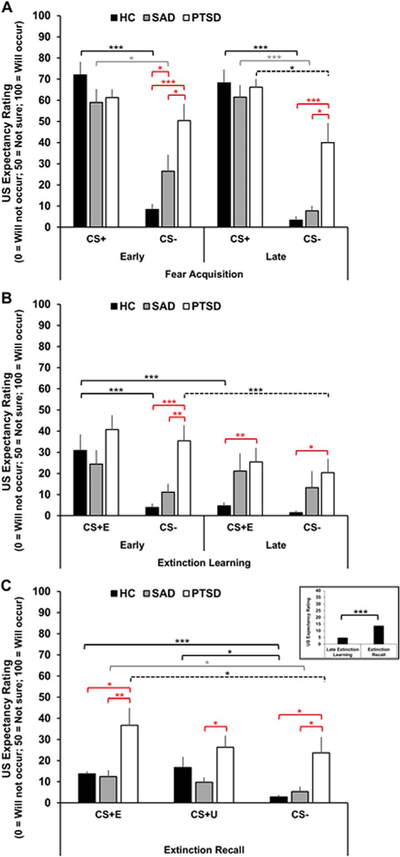
A, Mean US expectancy ratings to the CS+ and CS- during early and late fear acquisition. B, Mean US expectancy ratings to the CS+E and CS- during early and late extinction learning. C, Mean US expectancy ratings to the CS+E (left), CS+U (middle) and CS- (right) during the extinction recall test. HC (black bars), SAD (gray bars), and PTSD (white bars). Inset shows a bar graph representing the mean US expectancy ratings to the CS+E during late extinction learning and extinction recall in the HC group. Error bars are standard error of the mean (SEM). Brackets indicate significant differences within groups (HC, black; SAD, gray; PTSD, dashed) and between groups (red). *p≤.05**p≤.01***p≤.001. (For interpretation of the references to color in this figure legend, the reader is referred to the web version of this article.).