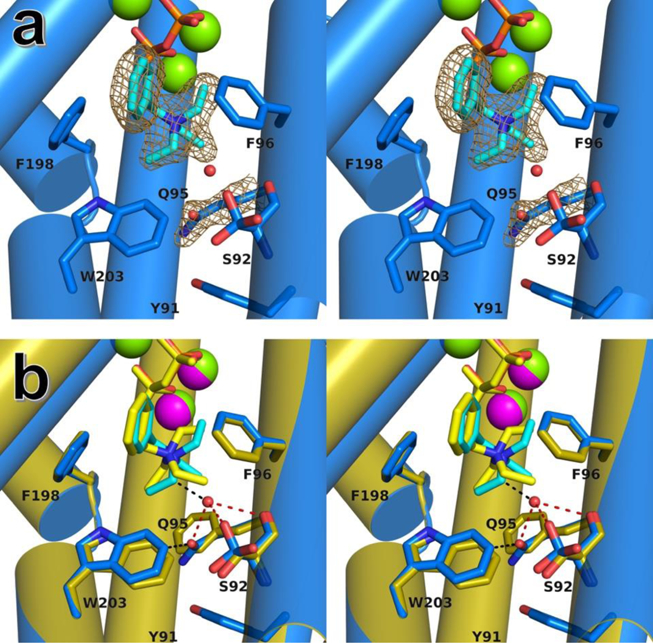
Figure 3.

(a) Stereoview of F95Q EIZS-Mg2+3-PPi-BTAC complex, showing Polder omit maps for BTAC and Q95 (contoured at 6σ and 4σ, respectively). Color codes are as follows: C (protein) = blue, C (BTAC) = cyan, N = dark blue, O = red, P = orange, Mg2+ ions = green spheres. Water #372 is shown as a small red sphere. (b) Complex in (a) superimposed on the wild-type EIZS-Mg2+3-PPi-BTAC complex (gold; Mg2+ ions = magenta spheres). Hydrogen bond interactions are indicated by red dashed lines. Other interactions are shown as black dashed lines.
