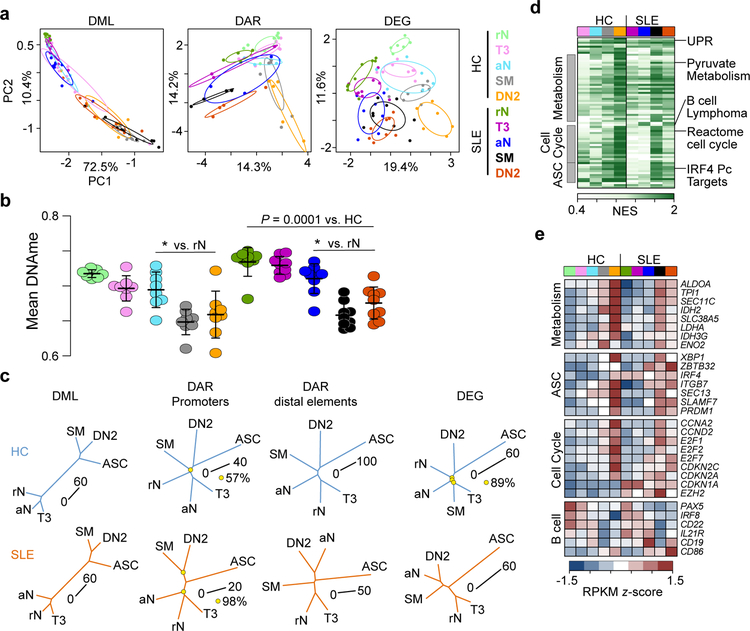
Figure 1. Epigenetic states of B cell subsets identify cell type relationships and differentiation hierarchies.
(a) Principal component analysis (PCA) of differentially methylated loci (DML)(left), differentially accessible loci (DAR)(middle), and differentially expressed genes (DEG)(right) between cell types. Each cell type is indicated by a point and 99% confidence intervals for each cell subset are denoted by a circle. Sample sizes for each cell type can be found in Supplementary Table 5. (b) Mean CpG methylation for each cell type is plotted. Data represent mean ±SD. Significance determined by two-way ANOVA with Tukey’s post-hoc test. * indicates P < 0.05 for the indicated comparison to rN. (c) Phylogenetic dendrograms for HC (top) and SLE (bottom) subsets for the indicated data. Length of tree branches between cell types represents Euclidean distance, which is denoted for each tree with a scale bar. Reproducibility of tree structure was tested using a bootstrapping analysis and nodes that were less than 100% reproducible are indicated with a yellow circle. Data were averaged for each cell type. (d) Heatmap of normalized enrichment score (NES) calculated by GSEA for pathways upregulated in cell types compared to rN B cells. HC and SLE B cells are separated and a subset of gene sets are grouped into common pathways. ASC, antibody-secreting cell. See also Supplementary Fig. 3. (e) Heatmap of z-score normalized RPKM expression for selected genes from enriched GSEA gene sets. Data represent the mean expression for each cell type.

