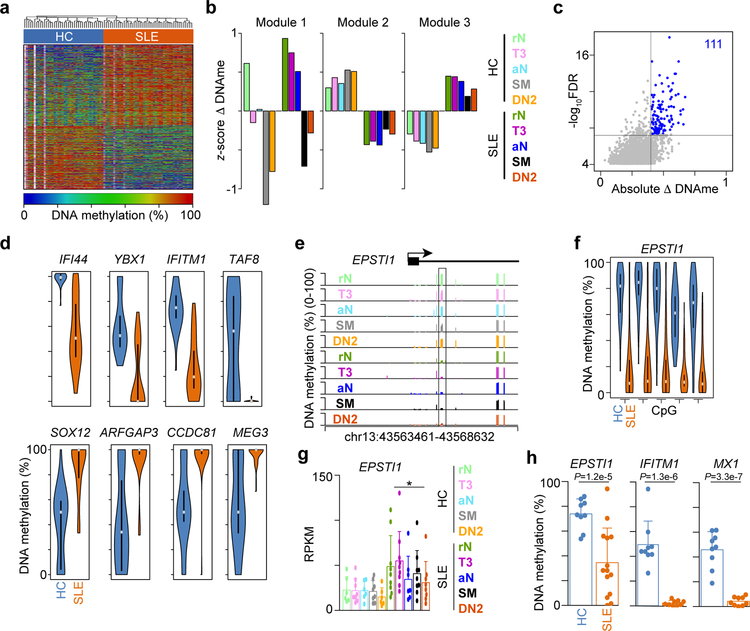
Figure 3. DNA methylation status stratifies HC and SLE B cell subsets.
(a) Heatmap of percentage change in DNA methylation at 6,664 DML shared across all B cell subsets. White represent CpG with no coverage in a particular sample. (b) DML in a were K-means clustered into three modules. Bar plot showing the average DNA methylation for each cell type in each module. (c) Significance test for DML in modules 2 and 3 from b identifying the DML that best stratify HC (n=43) and SLE (n=49) cell types. Scatter plot showing 111 DML with FDR < 1x10⁻⁶ and absolute DNA methylation change greater than 40%. Significance determined by two-sided t-test followed by Benjamini-Hochberg FDR correction. (d) Violin plots of the percent DNA methylation across all B cell subsets for HC (n=43) and SLE (n=49). Grey dots represent mean and filled boxes represent 1st and 3rd quartile ranges. (e) Genome plot of the EPSTI1 locus showing the location of CpG covered by RRBS. Significant DML between HC and SLE are boxed. Data represent the mean for each cell type from one experiment. (f) Violin plot of 5 CpG highlighted in e across all B cell subsets for HC (n=43) and SLE (n=49). Grey dots represent mean and filled boxes represent 1st and 3rd quartile ranges. (g) Bar plot of gene expression levels for EPSTI1. Data represent mean ±SD. * indicates DEG between SLE and HC (>=2-fold change and FDR < 0.05) as determined by edgeR. (h) qPCR quantitation of DNA methylation levels in rN B cells from an independent cohort of HC (n = 9) and SLE (n = 9) subjects. Significance determined by two-tailed Student’s t-test.

