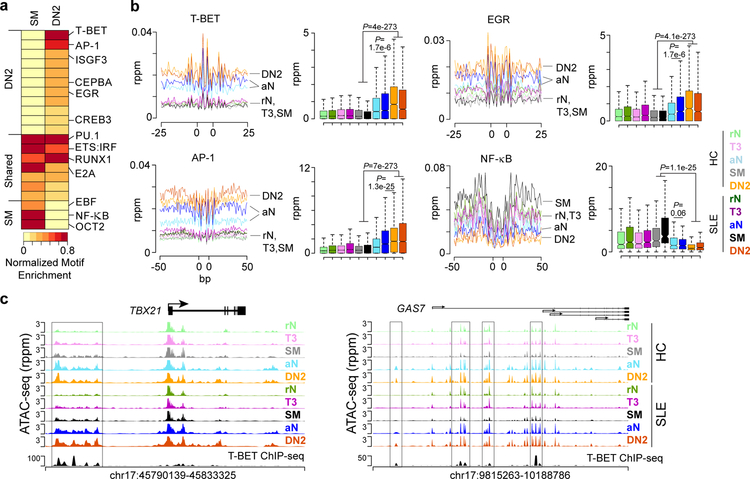
Figure 5. DN2 accessibility is driven by T-BET, AP-1 and EGR transcription factors.
(a) Heatmap depicting normalized enrichment of transcription factor motifs in DN2 and SM cell types. Enrichment P-values are normalized to the minimum value for each cell type. Motif grouping is indicated on the left. Significance determined by binomial distribution by HOMER. (b) Histogram (left) and box plot (right) of accessibility at the indicated motif and for the indicated surrounding sequence for each cell types. Data represent the mean for each cell type. The location of cell types is indicated for the histograms. Boxplot center line indicates data median, lower and upper bounds of boxes the 1st and 3rd quartile ranges, and whiskers the upper and lower ranges of the data. Significance determined by two-tailed Student’s t-test. See also Supplementary Fig. 7. (c) Genome plot showing accessibility and T-BET binding in GM12878 B cells36 for the indicated loci. DAR between DN2 and SM with T-BET binding peaks are highlighted. Data represent the mean for each cell type from one experiment.

