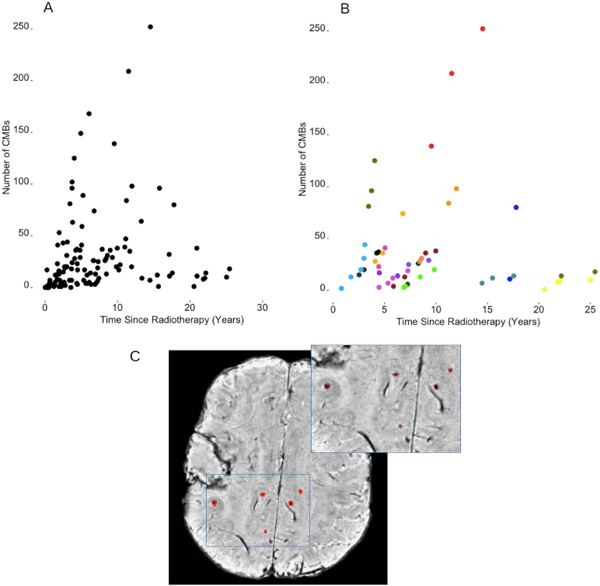
Figure 1.

Total number of CMBs as a function of time since radiotherapy in all patients treated with RT (panel A) and in those patients who underwent serial imaging (panel B). Each data point corresponds to a single imaging time point. In panel B, different colors correspond to different patients. Panel C illustrates one representative patient case of candidate CMBs labeled on a non-projected SWI axial image slice. The surgical cavity in the right hemisphere containing unrelated blood product that has been excluded from the analysis. The blue outlined region of interest is magnified in the top right corner for better visualization.
