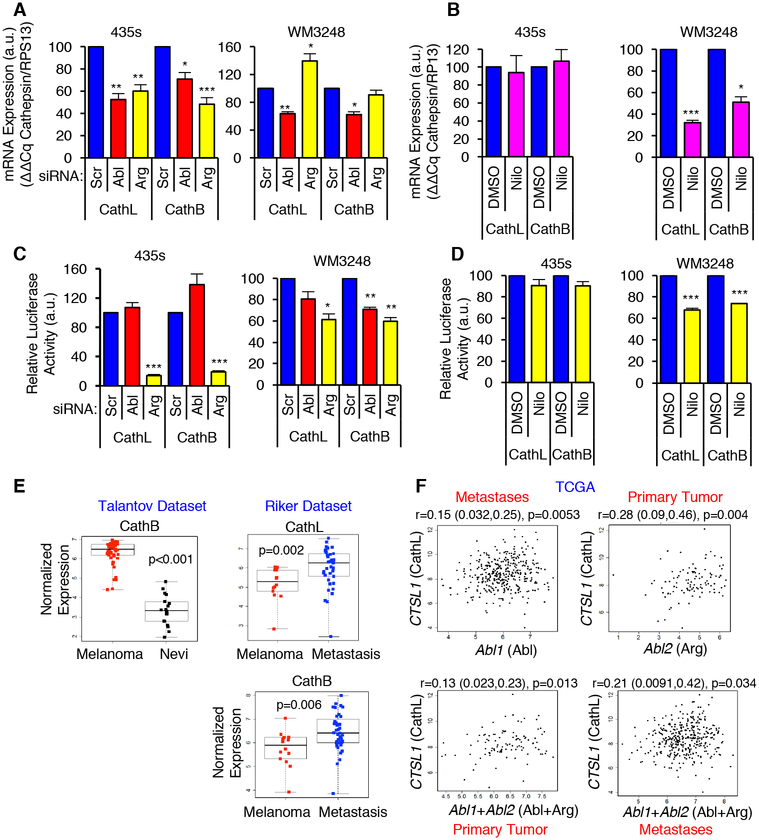
Fig. 4. Abl/Arg increase cathepsin mRNAs and transcription.
(A,B) qPCR analyses on RNA from siRNA-transfected or nilotinib-treated cells (see Figs. 2, 3). Mean±SEM, n=3 normalized to RPS13. ***p<0.001, **p<0.01, *p<0.05 using one-sample t-tests and Holm’s adjustment for multiple comparisons. (C,D) Gaussia luciferase activity was measured in the media of siRNA-transfected (C) or nilotinib-treated (D) cells stably expressing cathepsin L or B promoter-luciferase constructs. Mean±SEM, n=3 normalized to total protein in the lysate. ***p<0.001, **p<0.01, *p<0.05 using one-sample t-tests and Holm’s adjustment for multiple comparisons. (E) Oncomine datasets (29, 30) were downloaded and reanalyzed using two-sample t-tests (for normally distributed data; Shapiro-Wilk test) or Wilcoxon ranksum tests. Nevi=benign nevi. (F) Normalized TCGA RNAseq data for primary melanomas and metastases were analyzed with Spearman’s correlation coefficient. Correlation (r), 95% confidence limits (in parentheses), and p-values are shown.

