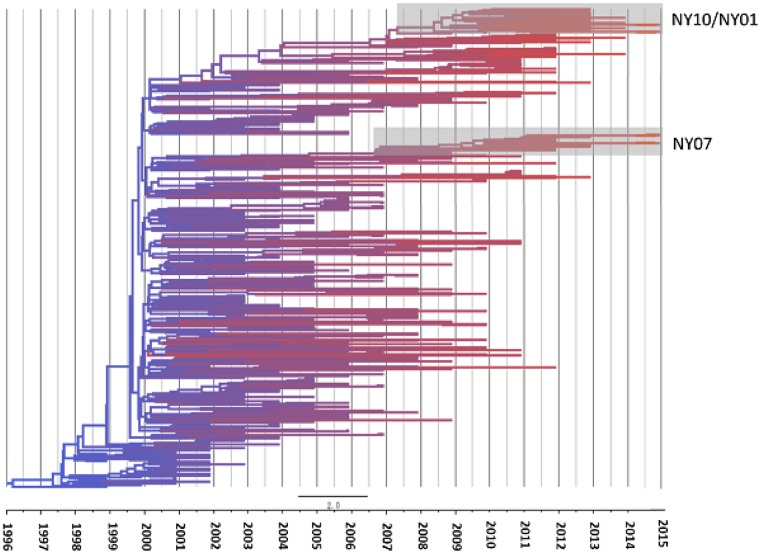
Figure 4.
Time tree based on Bayesian analysis of WNV isolates from NYS. Branch color reflects the age of the sequence, red branches representing the most recent strains. Clusters containing genotypes NY07 and NY10/NY01 which are highlighted have posterior probabilities of 0.98 and 1.0, respectively.

