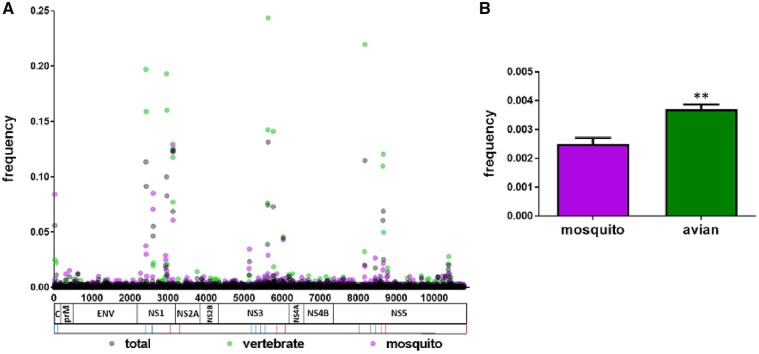
Figure 7.
Intrahost diversity of WNV isolates from NYS, 2000 to 2015. Data are shown as proportion of non-consensus reads (A) at each position across the WNV genome and (B) overall, for the 317 isolates for which deep-sequencing data was available. Significance (t-test, P < 0.001) is denoted with **. Sequencing primers, forward and reverse, correspond to those in Supplementary Table S1 and are indicated by blue (forward) or red (reverse) lines below genome.

