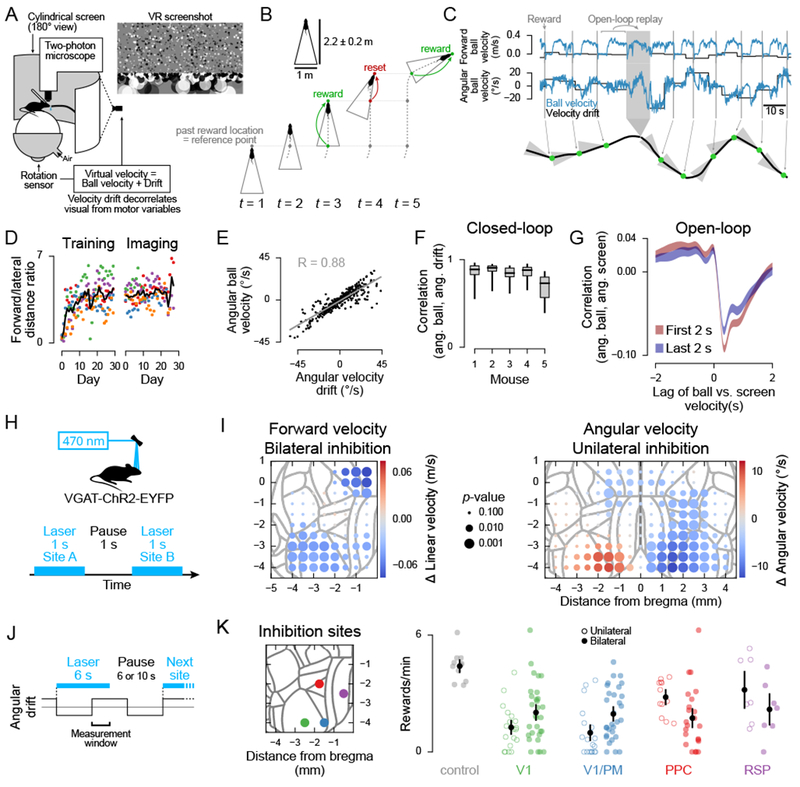
Figure 1. A visually guided locomotion task that engages posterior cortex.

(A) Experimental setup and screenshot of the virtual reality environment.
(B) Schematic of the reward condition in the task (top-down view). Dashed lines, path taken by the mouse. Solid gray triangle, invisible boundaries used to determine reward delivery (Methods).
(C) Top: Example velocity traces. Bottom: Corresponding top-down view of the path taken by the mouse. Green dots indicate reward times.
(D) Task performance during training and imaging. The ratio between the forward distance to the lateral distance covered by the mouse was used to assess the efficiency of the mouse’s behavior. Each dot is one session; colors indicate different mice. Black line, mean across mice (n = 5).
(E) Correlation between angular ball velocity and velocity offset for one session. Each dot shows the mean velocity during a single epoch with a single drift value. Only closed-loop segments are included. Gray line, least squares fit; R, Pearson correlation coefficient. (n = 386 drift epochs)
(F) Boxplot of the correlation between angular velocity and drift as in (E), for all sessions for each mouse. Line, median; box, first to third quartile; whiskers, range (23.6 ± 5.99 sessions per mouse, mean ± s.d).
(G) Cross-correlation between angular screen and ball velocity during open-loop segments. Red line, first 2 s of segment; blue line, last 2 s of segment; shading, mean ± s.e.m. across sessions (n = 118).
(H) Schematic of optogenetics setup during the task, with the drift velocity set to zero.
(I) Effect of targeted inhibition on locomotion velocity. Each dot represents an inhibition site that was randomly targeted. Dot color represents the difference between pre- and post-inhibition velocity, and dot size represents significance based on hierarchical bootstrap (Methods). Effects were smoothed with a 1 mm square window. Gray outlines, area parcellation from the Allen Mouse CCF (22,384 unilateral and 10,661 bilateral trials; 158.87 ± 21.14 per location, mean ± s.d.; 19 sessions; 3 mice).
(J) Protocol for targeted inhibitions during the full task (with velocity drift).
(K) Left: Map of targeted sites. Right: Each dot represents the average reward rate during inhibition after a drift switch (see “measurement window” in (J)) for a single session. In the control condition, the laser was on, but targeted to a site on the metal headplate. Black dots, mean; error bars, 5th and 95th percentile of a bootstrap distribution of the mean. Conditions vs. control: p < 10−4, except for RSP, p = 0.056. Unilateral vs. bilateral: p < 0.01 for V1, V1/PM, PPC, p = 0.21 for RSP. The difference between unilateral and bilateral mean effects was significantly different for V1 and PPC (p = 0.0016), V1/PM and PPC (p = 0.001), V1 and RSP (p = 0.038), and V1/PM and RSP (p = 0.023), but not for V1 and V1/PM (p = 0.717), and PPC and RSP (p = 0.939). Two-tailed p-values based on 104 resampling iterations.
See also Supplemental Video.
