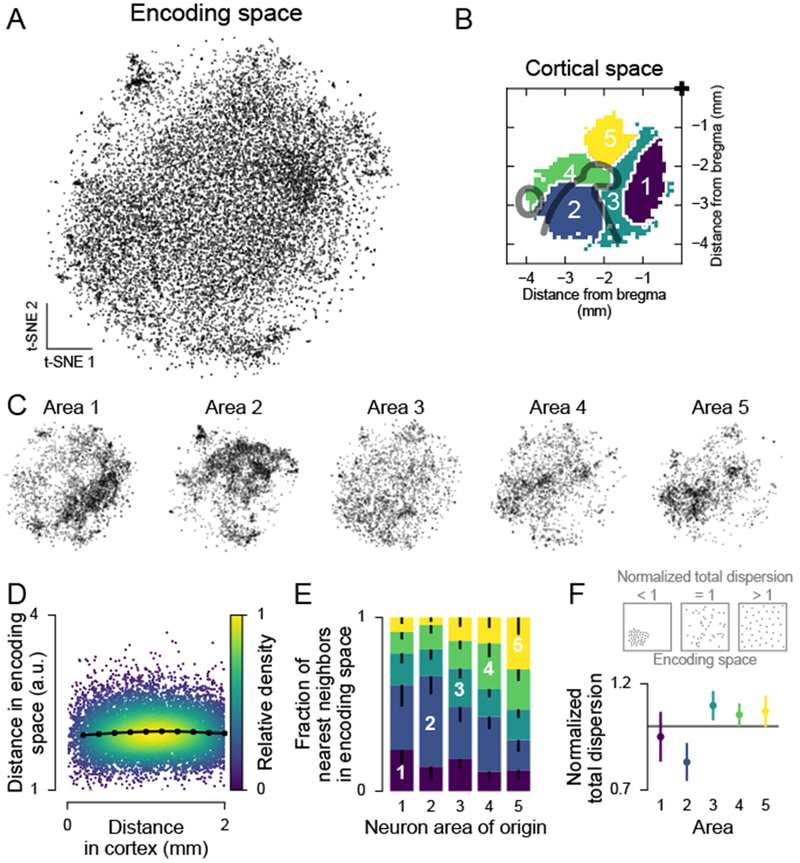
Figure 4. Anatomically defined populations showed diverse encoding properties.

(A) t-SNE of the factor weights for all neurons.
(B) Parcellation of cortex used in (C). From Figure 3B.
(C) Same embedding as in (A), but split by areas in (B).
(D) Relationship between anatomical and encoding-space distance. Each dot is one neuron pair. Black line, mean (computed in 200 μm bins). Pearson correlation for 0-500 μm: 0.032 (greater than zero, p < 10−323, n = 10,977,961 neuron pairs).
(E) Anatomical location of nearest-encoding-space-neighbors for neurons in all areas in (B). Neurons were randomly subsampled to match neuron numbers across areas. Colors as in (B). Error bars (only lower tail is drawn), fifth percentile of hierarchical bootstrap of the mean.
(F) Top: Schematic of the normalized total dispersion statistic. A normalized total dispersion value less (greater) than one means less (more) dispersion in weight space than the overall population. Bottom: Normalized total dispersion for the areas in (B). Error bars, 5th and 95th percentile of hierarchical bootstrap of the mean. The mean is different from 1 with: area 1, p = 0.256, n = 3518; area 2, p < 10−3, n = 3407; area 3, p = 0.018, n = 2389; area 4, p = 0.059, n = 2065; area 5, p = 0.075, n = 1959 neurons.
See also Figure S5.
