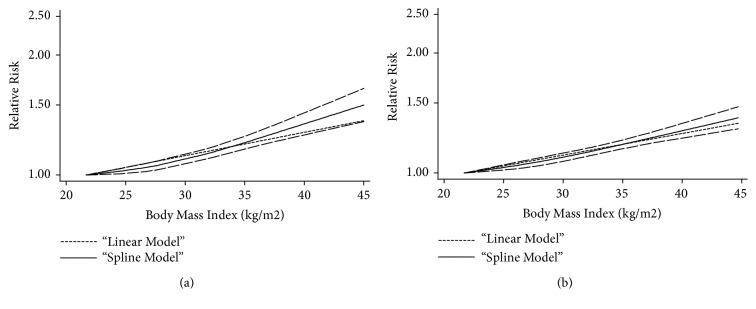
Figure 5.
The dose-response analysis between maternal BMI and CHDs risk in infants by adjustment of study design. (a) Cohort studies; (b) case-control studies. The solid line and the long dash represented RR and its 95% CI. Short dash line represents the linear relationship (per 5 kg/m2 increment). RR, relative risk, CI, confidence interval; BMI, body mass index.

