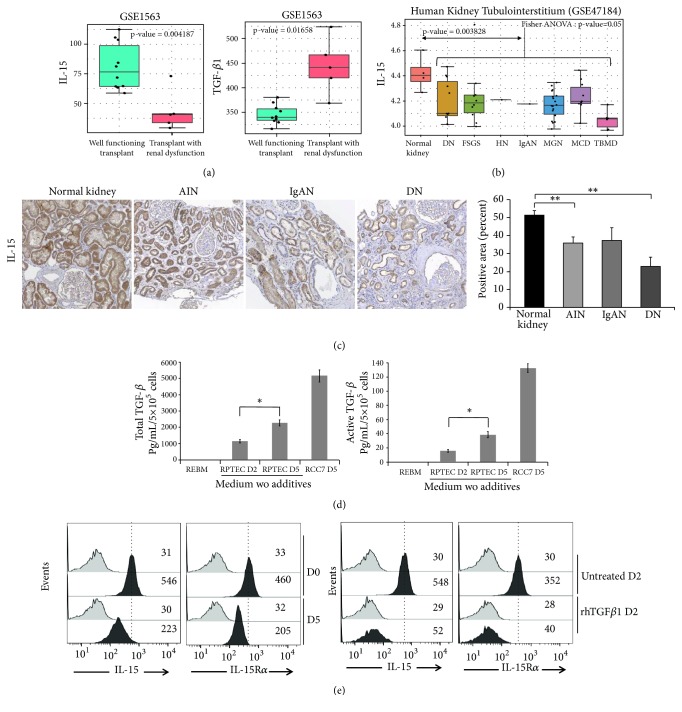
Figure 1.
IL-15/TGFβ ratio is unbalanced in human chronic kidney disease and in a “spontaneous EMT model”. (a) Boxplot of IL-15 and TGF-β1 transcript quantification in transplant patients from well-functioning transplants with no clinical evidence of rejection in comparison of transplant patients from transplants with renal dysfunction without rejection (GSE1563); p values for IL-15 (p<0.01) and TGF-β1 (p<0.05) were estimated by two sided Student's t-test. (b) Boxplot of IL-15 mRNA transcript quantification by Affymetrix transcriptome (GSE47184) comparing kidney tubulointerstitium from divers human nephropathies (diabetic nephropathy (DN), focal segmental glomerulosclerosis (FSGS), hypertensive nephropathy (HN), IgA nephropathy (IgAN), membranous glomerulonephritis (MGN), Minimal Change Disease (MCD), thin basement membrane disease (TBMD) as compared to same tissue from normal kidney, p value from global comparison was performed with Fisher one-way ANOVA (p≤0.05), and comparison of control versus pooled nephropathies was done by two sided Student's t-test (p<0.01). (c) Immunohistochemistry for IL-15 in normal and pathological kidneys, including acute interstitial nephritis (AIN), IgAN, and DN (n=5–7 patients per group). Positive staining was quantified by morphometric analysis (bar chart). ∗∗p<0.01. (d) In the “spontaneous EMT model” (five days of growth supplements deprivation and absence of daily medium) both total and active TGF-β1 forms were quantified in 2-5 days RPTEC-derived conditioned media using a biological specific assay (∗ p<0.05, n=3, ±SEMs). Five days of conditioned media from the human renal cell carcinoma cell line RCC7 were used as positive control of TGF-β1 secretion. (e) Membrane-bound IL-15 and IL-15Rα expression on RPTEC cells was analyzed by flow cytometric analysis after a 5 days “spontaneous EMT” (upper panels) or a 2-days rhTGF-β1 treatment (3 ng/mL, lower panels). Grey histograms refer to isotype-matched control and black histograms to surface IL-15 or IL-15Rα molecules. Mean fluorescence intensity values for each marker are shown in each histogram. The data are representative of 3 separate experiments.

