Figure 2.

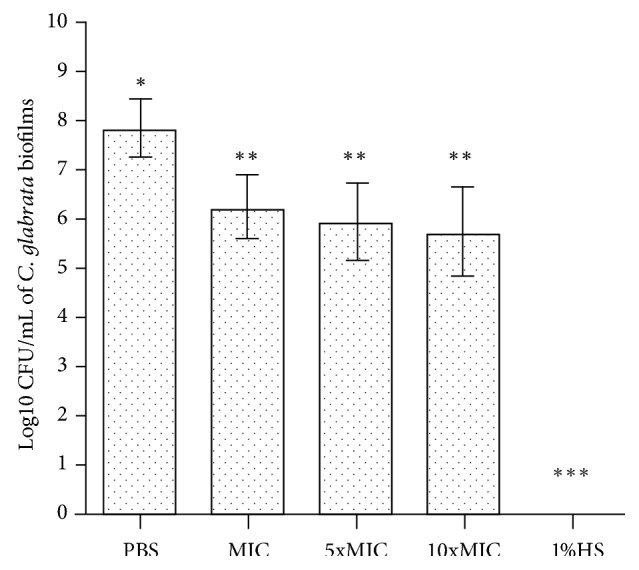
Effect of FBuTC on cell counts of biofilm of C. glabrata. The presence of different symbols (∗, ∗∗ and ∗) indicated statistically significant difference between the groups (one-way ANOVA followed by the Tukey test, p < 0.05).

Effect of FBuTC on cell counts of biofilm of C. glabrata. The presence of different symbols (∗, ∗∗ and ∗) indicated statistically significant difference between the groups (one-way ANOVA followed by the Tukey test, p < 0.05).