
Figure 4.
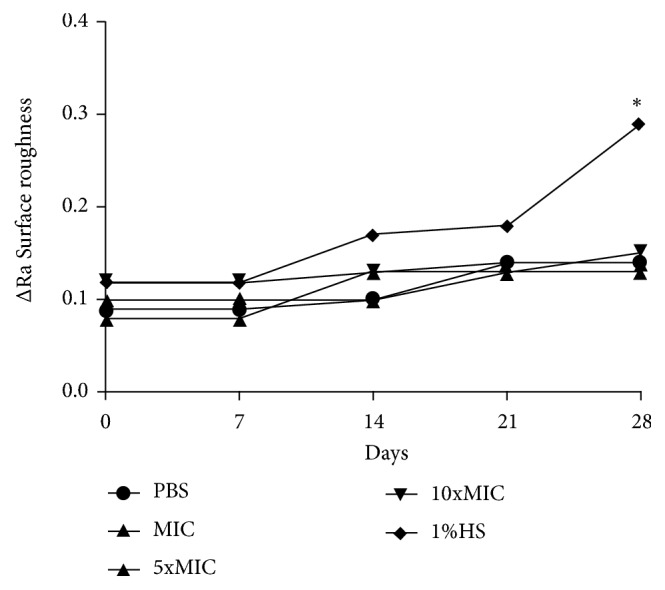
Surface roughness values (ΔRa) after 28 days of immersion of acrylic resin specimens in FBuTC. The presence of symbol (∗) indicated statistically significant difference between the groups (two-way ANOVA for repeated measures followed by the Tukey test, p < 0.05).