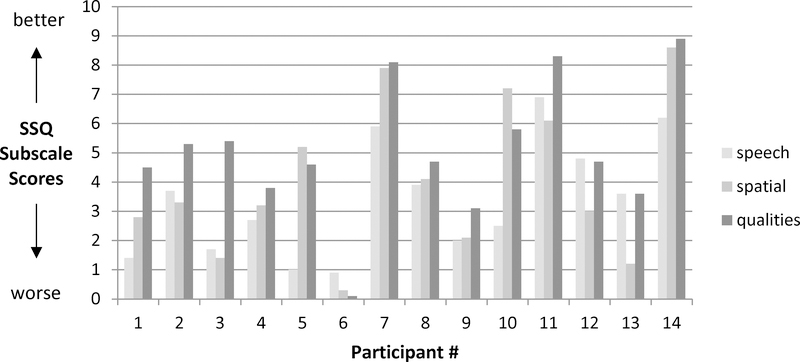
Figure 2. Baseline Speech, Spatial and Qualities Hearing Scale scores.
The vertical axis shows SSQ subscale scores, where higher scores represent better responses (less hearing difficulty) and lower scores represent worse responses (more hearing difficulty). The horizontal axis has three columns per study participant, one for each of the SSQ subscales.

