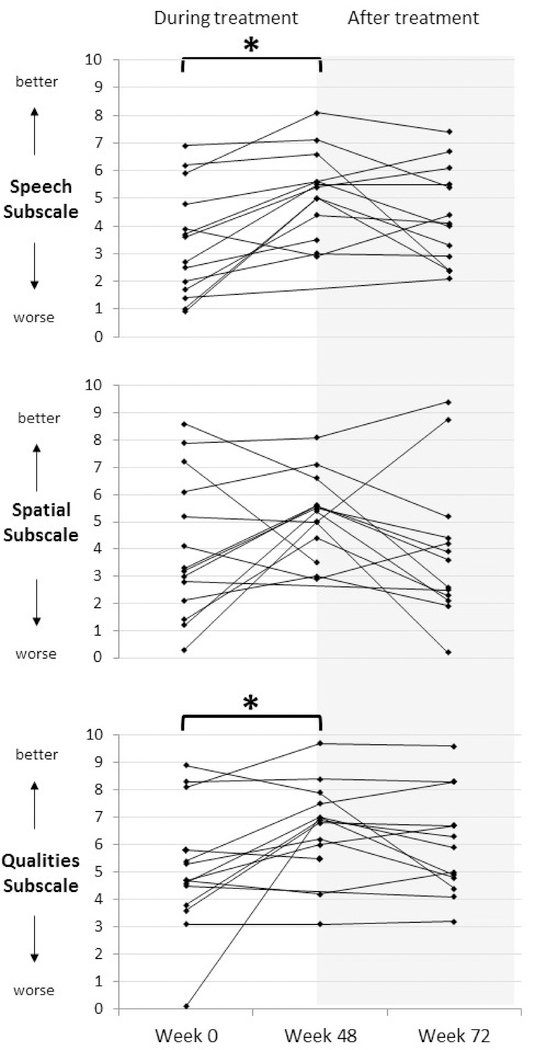
Figure 4. SSQ results before, during, and after treatment with bevacizumab.
There are three panels, one for each of the SSQ subscales. The vertical axes show the SSQ scores for each case, wherein higher scores represent better outcomes (less hearing difficulty). The horizontal axis marks the study timepoints at baseline, the end of treatment (week 48) and the off-study evaluation (week 72). Brackets with an asterisk indicate a statistically significant improvement at the P < 0.05 level.

