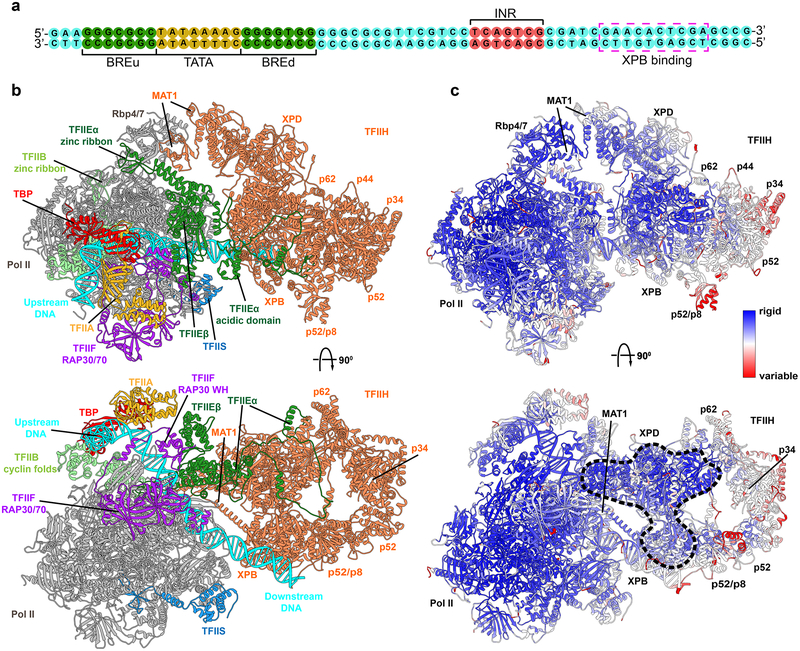
Figure 2. TFIIE links human PIC to TFIIH.
a, Sequence of the DNA substrate in PIC. b, Cartoon of human PIC structure including TFIIH highlighting non-TFIIH subunits. Most striking is TFIIE which crosses over a quarter of TFIIH. Model is based on integration and comparative analysis of cryo-EM densities for human apo-TFIIH, human closed-state holo-PIC density, and yeast core-PIC–TFIIH–DNA c, Computed B-factors mapped onto the PIC-TFIIH structural model with values colored from high (red) to low (blue) reveal a network of stable interactions. Black dashed outline highlights an unexpected rigid anchor region between TFIIH and PIC.

