
Fig. 3.
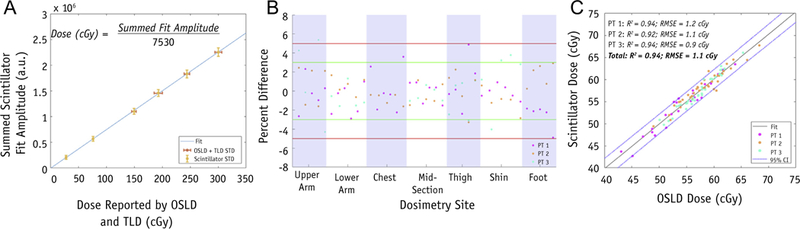
Plots for calibration, percent difference, and scintillator versus OSLD dose measurements. (A) Summed-fit amplitudes (a.u.) averaged for all scintillators and corresponding dose reported by averaging OSLD (cGy), standard error for OSLD + TLD, and scintillators shown in red and yellow, respectively. The equation for obtaining the calibration factor is provided. (B) Percent difference in dose reported by scintillator and OSL dosimeters per dosimetry site for all patients; ±5% and ±3% shown in red and green, respectively. (C) Dose measured by scintillator versus OSLD per dosimetry site; linear trendline and 95% confidence interval are plotted. R2 and root mean square error are shown for both individual patients and the entire cohort. Abbreviations: a.u. = summed-fit amplitudes; CI = confidence interval; OSLD = optically stimulated luminescence dosimeters; PT = patient; RMSE = root mean square error; TLD = thermoluminescent dosimeters. (A color version of this figure is available at https://doi.org/10.1016/j.ijrobp.2018.10.030.)