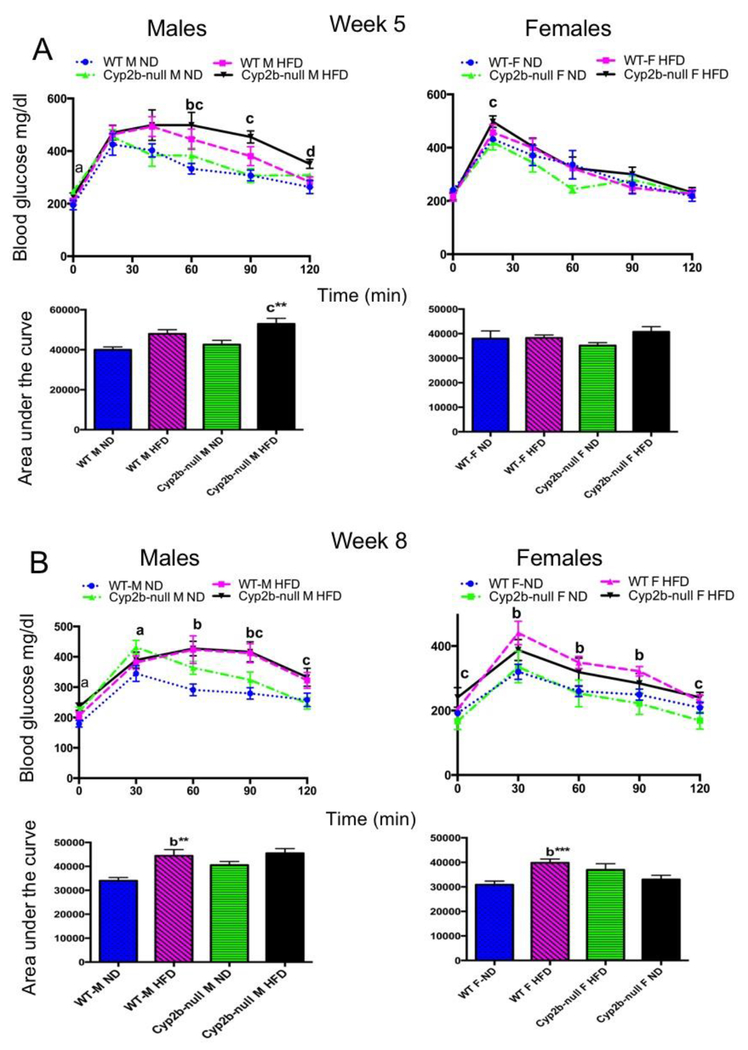
Fig. 2: Glucose tolerance tests do not show significant differences between WT and Cyp2b-null mice:
Glucose tolerance tests were performed on weeks 5 (A) and 8 (B) as described in the Materials and Methods. Results are shown for males and females over the time course of the assay and as area under the curve (AUC). Data are presented as mean ± SEM. Statistical significance was determined by one-way ANOVA followed by Fisher’s LSD as the post-hoc test (n= 8-9). ** Indicates a p-value ≤ 0.01. An ‘a’ indicates WT-ND are different than Cyp2b-null-ND, ‘b’ indicates WT-ND are different than WT-HFD, ‘c’ indicates Cyp2b-null-ND are different than Cyp2b-null-HFD, ‘d’ indicates WT-HFD are different than Cyp2b-null-HFD.

