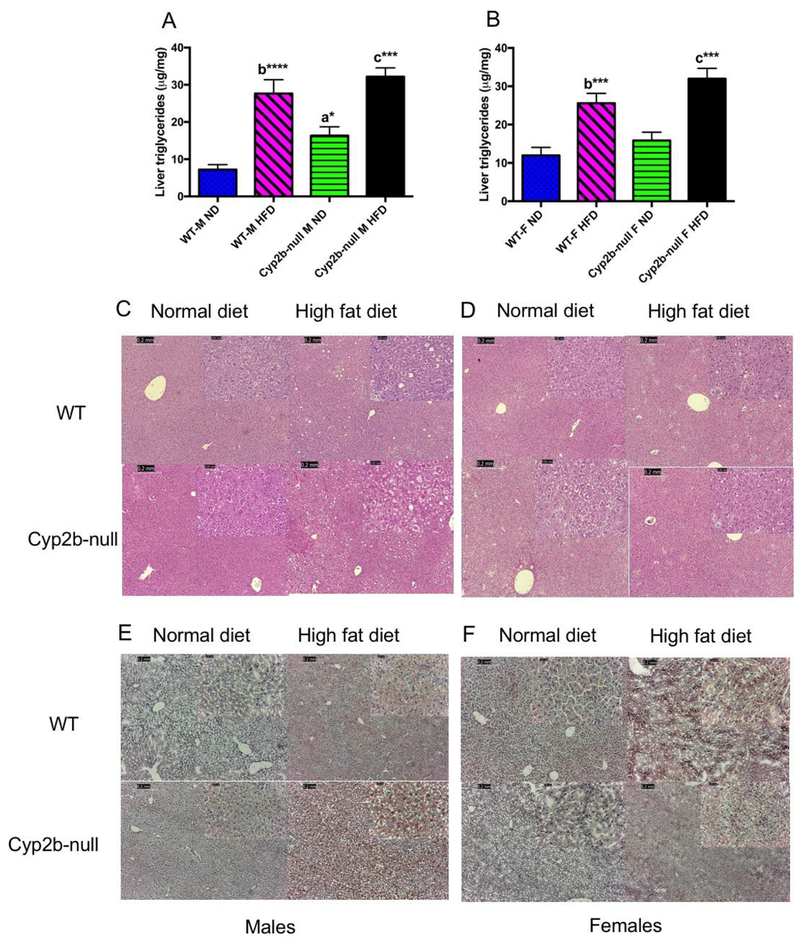
Fig. 3: Liver triglyceride concentrations are significantly increased in Cyp2b-null mice.
Liver triglycerides were extracted and determined as described in the Materials and Methods using commercial kits. Data are presented as mean ± SEM for males (A) and females (B). Statistical significance was determined by one-way ANOVA followed by Fisher’s LSD as the post-hoc test (n= 8-9). * indicates a p-value ≤0.05, *** indicates p-value ≤0.001 and **** indicates p-value ≤ 0.0001. An ‘a’ indicates WT-ND are different than Cyp2b-null-ND, ‘b’ indicates WT-ND are different than WT-HFD, ‘c’ indicates Cyp2b-null-ND are different than Cyp2b-null-HFD, ‘d’ indicates WT-HFD different than Cyp2b-null-HFD. H&E staining was performed in male (C) and female (D) mice with increases in vacuolization in HFD-fed males. Oil Red O staining was also performed in male (E) and female (F) mice and indicate weak liver lipid staining in all ND treatments and greater triglyceride staining in HFD-fed Cyp2b-null males relative to their HFD-fed WT counterparts.

