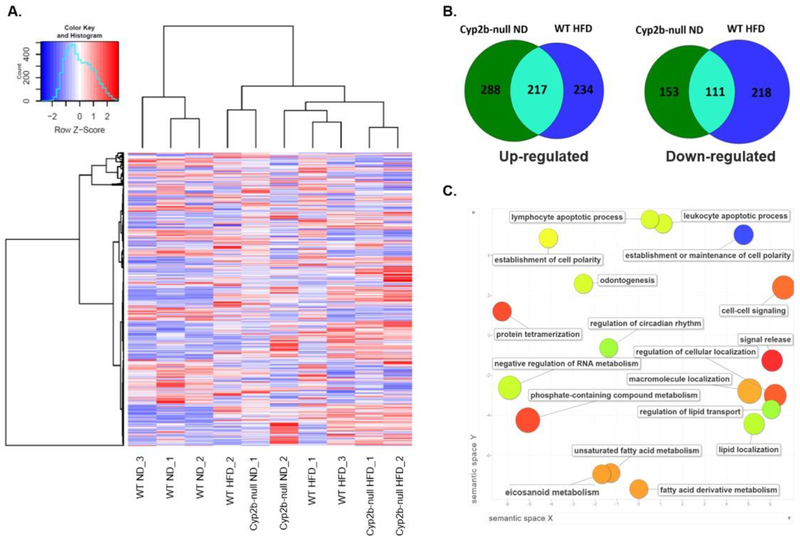
Fig. 6: Cyp2b-null male mice fed a ND display a similar gene expression profile to WT mice fed a HFD.
RNAseq was performed on liver samples from WT and Cyp2b-null mice fed either a ND or HFD. (A) Heat map showing log2-transformed, Z-score scaled RNA-Seq expression of 500 genes with the highest variance between treatment groups. Red and blue color intensity indicate gene up- or down-regulation, respectively. Dendrogram clustering on the x-axis indicates sample similarity, whereas dendrogram clustering on the y-axis groups genes by expression profile across samples. (B) Venn diagrams of shared up- and down-regulated differentially expressed genes (p<0.05) between Cyp2b-null ND-fed and WT HFD-fed mice compared to WT ND mice. (C) GO term enrichment analysis summary using Revigo [58] for significantly up-regulated genes in Cyp2b-null ND mice compared to WT ND mice. The scatterplot contains enriched GO terms from the biological process class that remain after term redundancy is reduced and are displayed in a two-dimensional space where semantically similar GO terms are positioned closer together within the plot. Each circle represents an enriched GO term; the cooler the color of a term, the more significantly (p < 0.05) associated that term is with the group of genes being studied. Circle size indicates the frequency of the GO term in the underlying GO database, i.e. circles of more general terms are larger.

