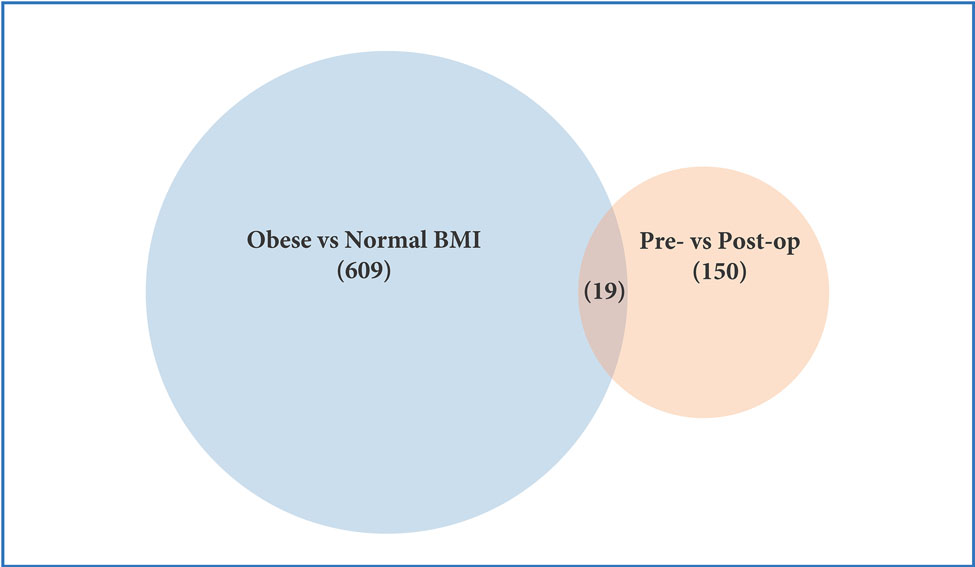
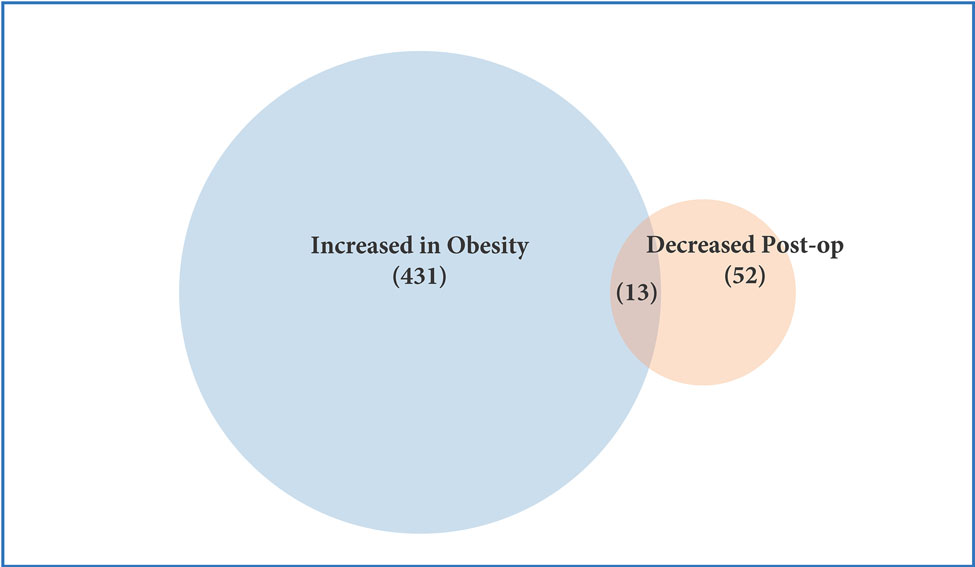
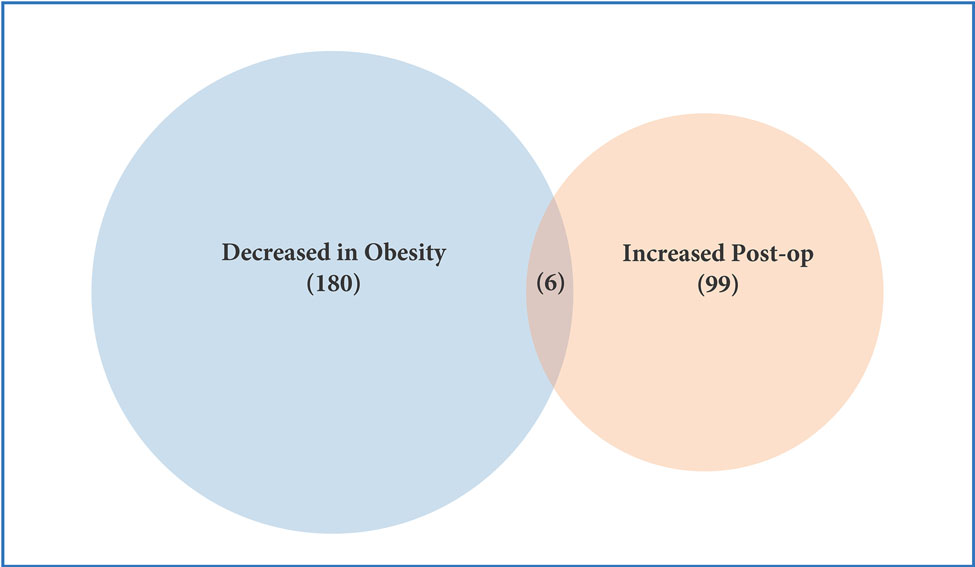
Figure 2.
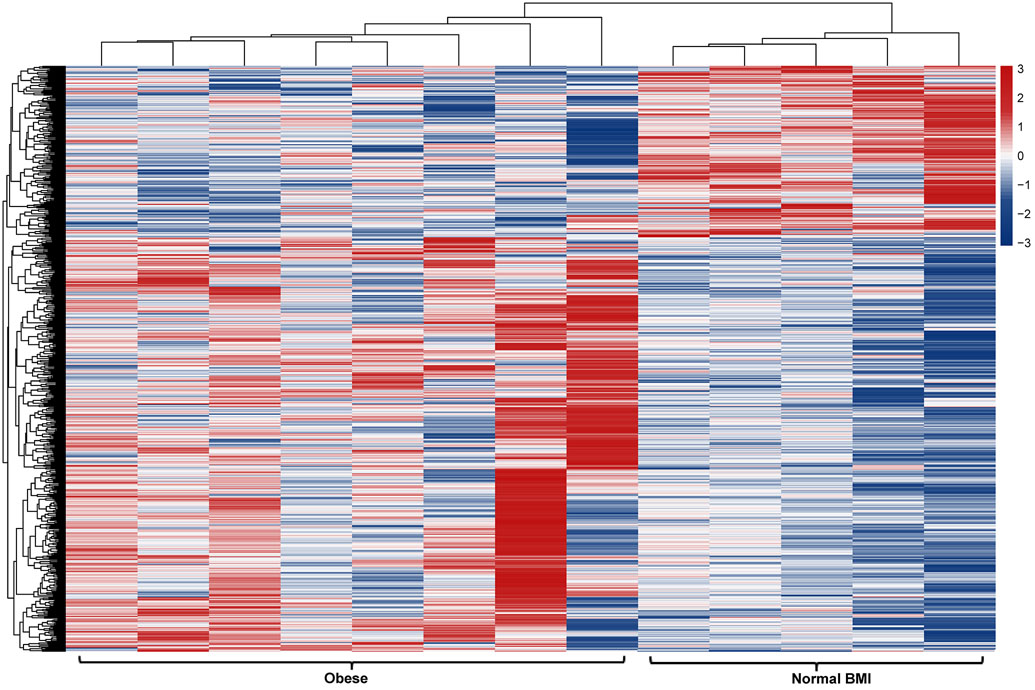
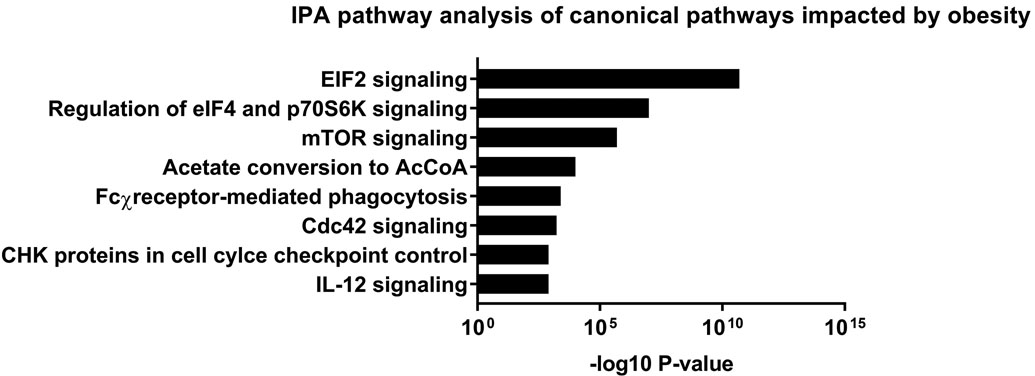
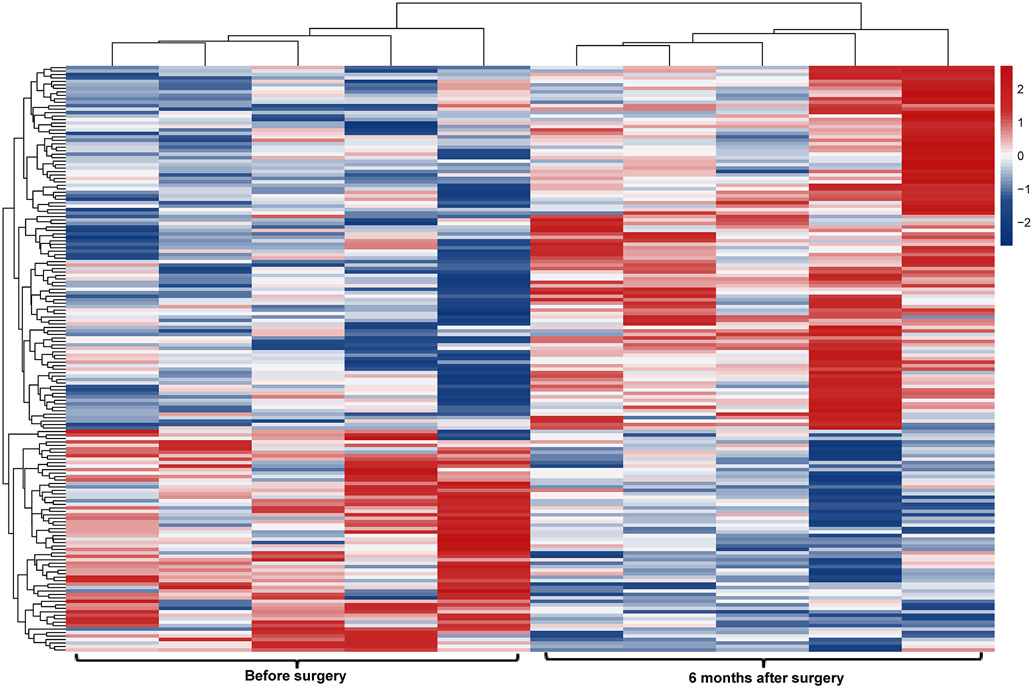
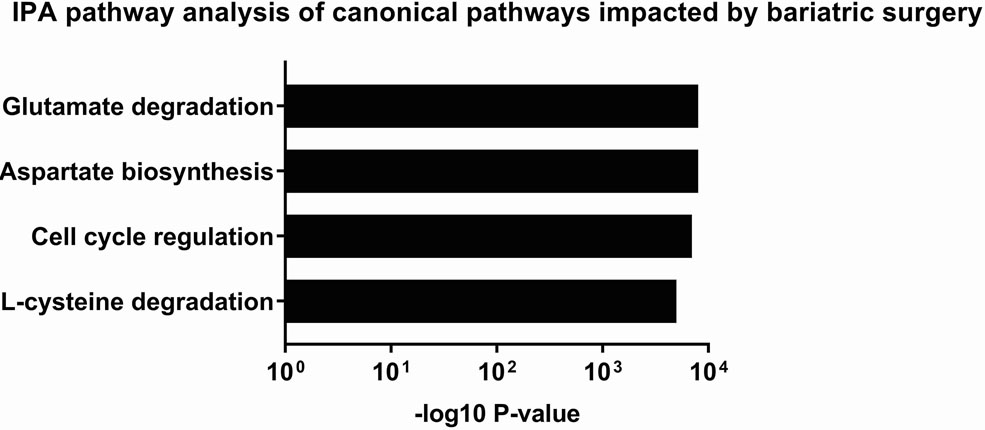
Profiling of platelet mRNA expression in obese women. (a) Heatmap of platelet transcripts differentially expressed between obese women (n=8) and normal BMI women (n=5) with p-value <0.05 and base mean counts >5. (b) Top pathways of platelet transcripts differentially expressed in obese versus normal BMI women. (c) Heatmap of platelet transcripts differentially expressed between obese women (n=5) before and at six months following sleeve gastrectomy with p-value <0.05 and base mean counts >5. (d) Top pathways of platelet transcripts differentially expressed in obese women at six months after sleeve gastrectomy. (e) Venn diagrams representing platelet transcripts differentially expressed in obesity and bariatric surgery.

