
Figure 2.
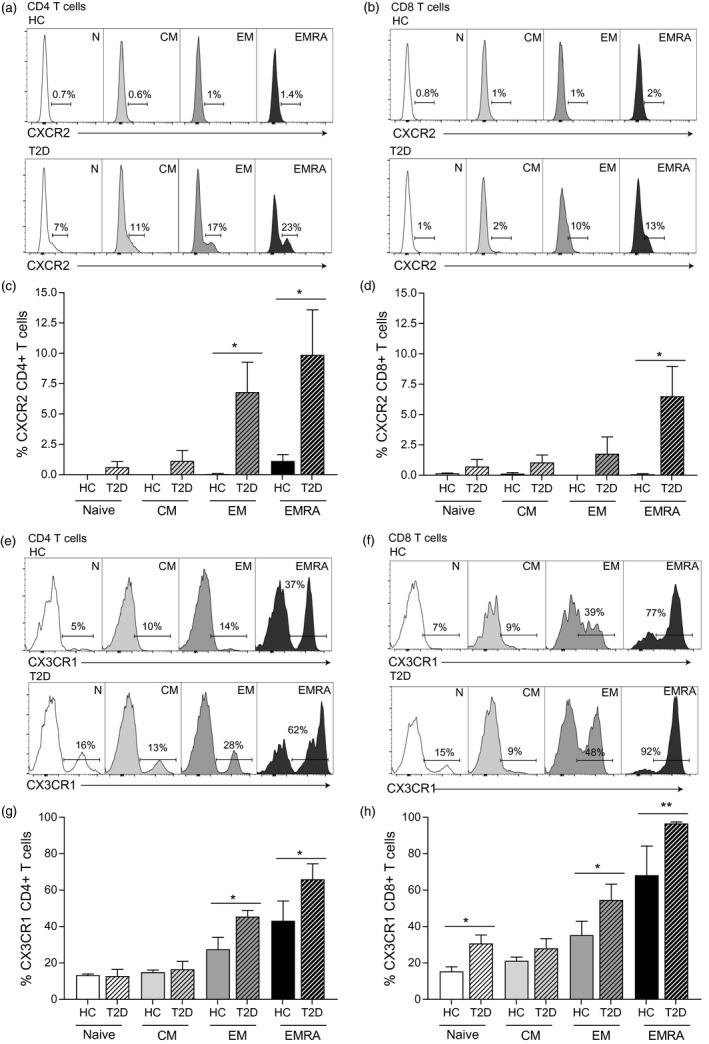
People living with type 2 diabetes (T2D) show increased proinflammatory chemokine receptor expression. Flow cytometry plots showing the expression of CXCR2 on both CD4+ (a) and CD8+ (b) CD45RA/CCR7 defined T cells from healthy controls and patients with T2D aged > 55 years. Together with graphs showing cumulative CXCR2 data from CD4+ (c) and CD8+ (d), T cells from nine healthy and nine T2D subjects. Representative CX3CR1 plots from both CD4+ (e) and CD8+ (f) T cell subsets and graphs for CD4+ (g) and CD8+ (h) T cells also from nine healthy and nine T2D individuals aged > 55 years. Graphs shows the mean ± standard error of the mean (s.e.m.) with P‐values calculated using a t‐test.