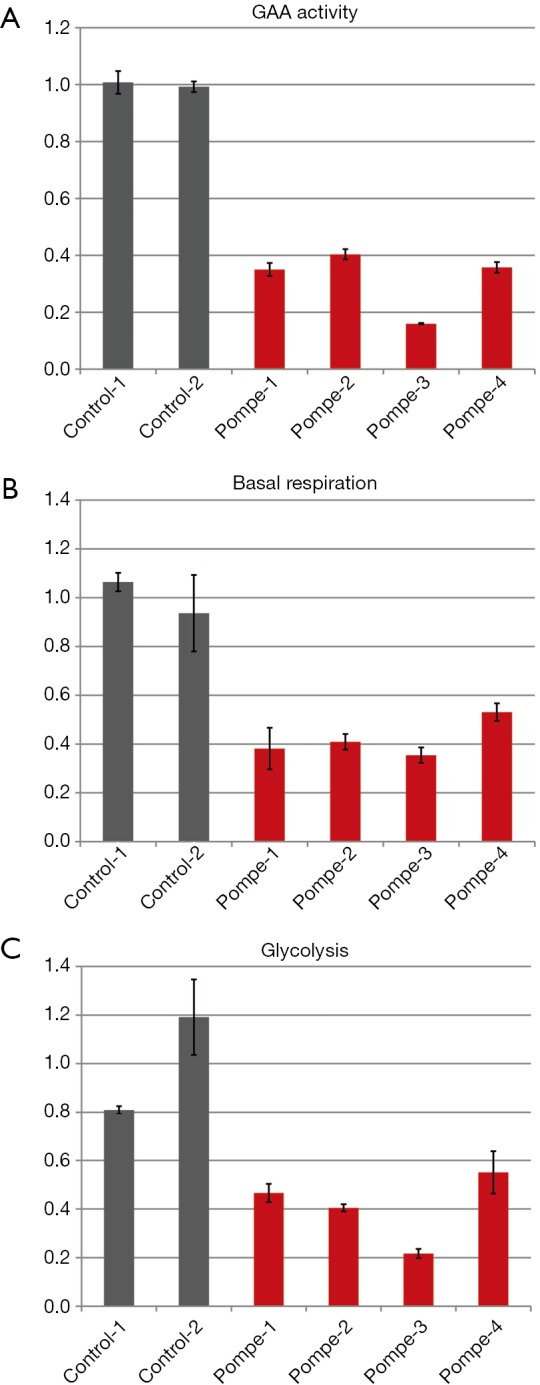
Figure 2.

GAA activity and metabolism of primary human myoblasts of a late-onset Pompe patient compared to non-disease human control specimen. (A) GAA activity of Pompe myoblasts (red) compared to controls (grey); in Pompe patients a 15% to 40% GAA activity compared to controls is displayed. (B) Basal respiration of Pompe myoblasts (red) compared to controls (grey) is declined by 30 to 60%; and (C) glycolysis of Pompe myoblasts (red) compared to controls (grey) shows a up to 70% lower level. All graphs with standard deviation and normalized to the mean of controls.
