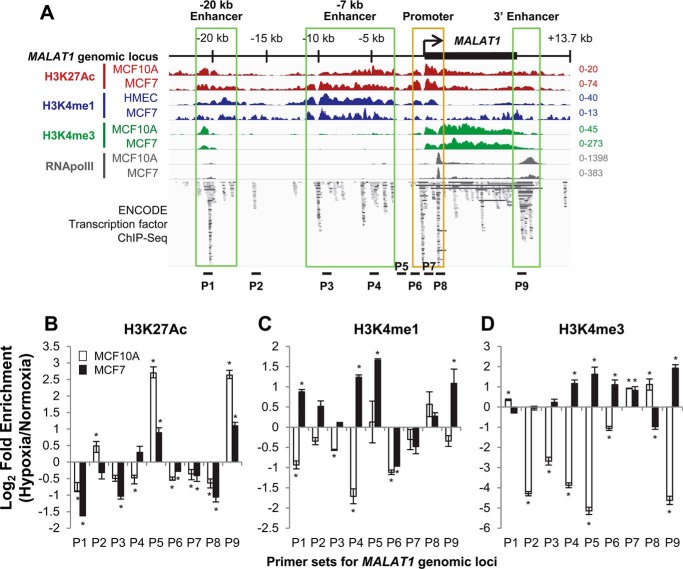
Figure 3.
The MALAT1 locus contains putative enhancers within the sequences upstream and downstream of the MALAT1 gene body and active chromatin marks are increased in some of these enhancer regions under hypoxia. A, location of putative enhancer regions within the MALAT1 genetic locus are indicated as labeled and highlighted in green boxes. The image incorporates ChIP-seq datasets from GSE107176 and ENCODE (58, 59). Loci for ChIP-qPCR primer sets are indicated as P1–P9. Distances for each primer set from the MALAT1 transcription start site are as follow: P1, −20.5 kb; P2, −15.9 kb; P3, −9.2 kb; P4, −4.7 kb; P5, −2.2 kb; P6, −0.8 kb; P7, +0.8 kb; P8, +1.4 kb; P9, +9.2 kb. B–D, ChIP-qPCR results of the log-fold change in enrichment of H3K27Ac (B), H3K4me1 (C), and H3K4me3 (D) levels in MCF10A (white bars) and MCF7 cells (black bars) following 24 h of exposure to normoxia or hypoxia. Data are shown as mean ± S.D. of one representative result from 5 independent biological replicates. *, p < 0.05.

