Figure 4.
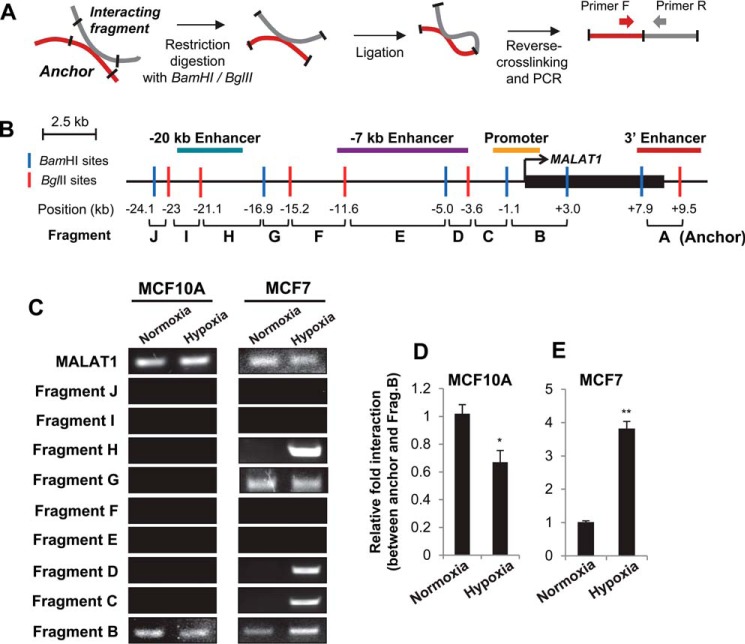
The 3′ enhancer gains extensive interactions with the MALAT1 promoter as well as upstream enhancers under hypoxia in breast cancer cells. A, experimental outline of the 3C assay. B, diagram of the MALAT1 genetic locus with the indicated BamHI (blue line) and BglII (red line) restriction sites for 3C. The position in kb of each restriction site relative to the MALAT1 TSS is listed at the bottom. The resulting 10 fragments were numbered A–J, by increasing distance from the MALAT1 transcription start site. The 3′ end fragment A containing the 3′ enhancer (red line) was used as the anchor for 3C experiments. The locations of the promoter (orange line), −20 kb enhancer (teal line), and −7 kb enhancer (purple line) are indicated. C, representative gel images of 3C-PCR results in MCF10A and MCF7 under normoxia or hypoxia. D and E, qPCR analyses of the relative interaction frequencies of hypoxia to normoxia for MCF10A (D) and MCF7 (E) between the anchor (3′ enhancer) and fragment B (promoter). Data are represented as mean ± S.D., n = 3, **, p < 0.01.

