
Figure 10.
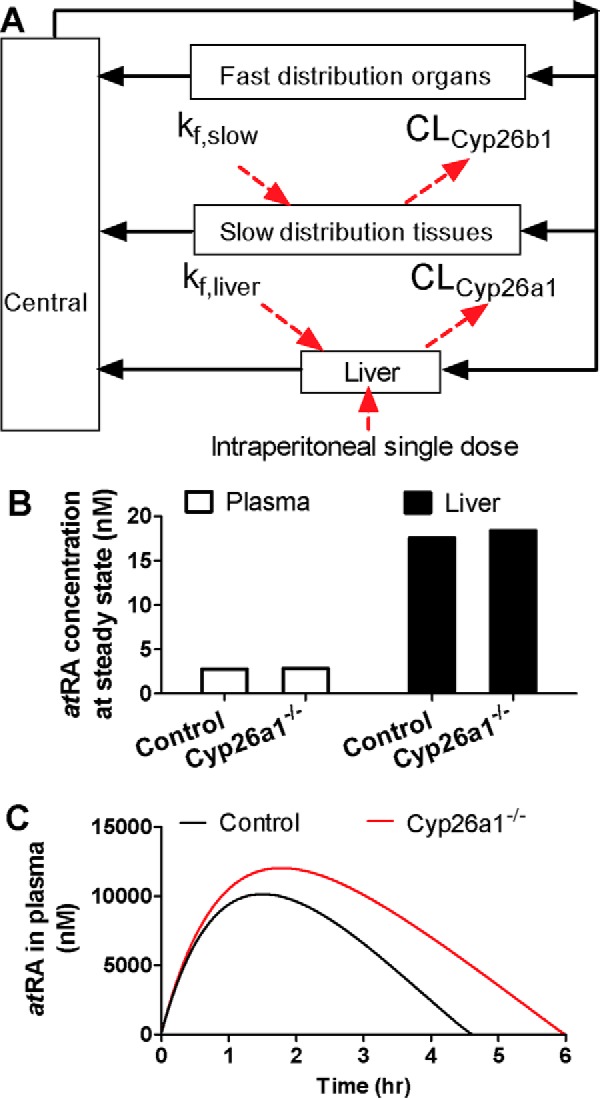
Simulation of the changes in endogenous and exogenous atRA concentrations in Cyp26a1−/− mice compared to Cyp26a1+/+ mice. The structure of the semi-physiologically–based model used to simulate atRA disposition is shown in A. Central compartment represents the central circulation system; fast-distributing organ compartment represents the visceral organs; and slow-distributing tissue compartment represents skin, adipose, bone, and muscle. kf, slow and kf, liver represent the endogenous formation rate of atRA in slow-distribution tissues and liver, respectively. CLCyp26b1 and CLCyp26a1 represent the atRA clearances by Cyp26a1 and Cyp26b1, respectively, modeled based on Michaelis-Menten kinetics. The intraperitoneal single dose of atRA was introduced to the liver compartment by a first-order absorption process. B shows the simulated steady-state (SS) atRA concentrations in plasma in the Cyp26a1+/+ (control) and Cyp26a1−/− mice. The simulated plasma concentrations are 2.77 and 2.85 nm in Cyp26a1+/+ and Cyp26a1−/− mice, respectively, and simulated hepatic atRA concentrations are 17.57 and 18.38 nm, in Cyp26a1+/+ and Cyp26a1−/− mice, respectively. The simulated plasma concentration versus time curve of atRA following i.p. dosing to Cyp26a1+/+ and Cyp26a1−/− mice is shown in C. The black curves show simulations for Cyp26a1+/+ (control) mice and red curves for Cyp26a1−/− mice.