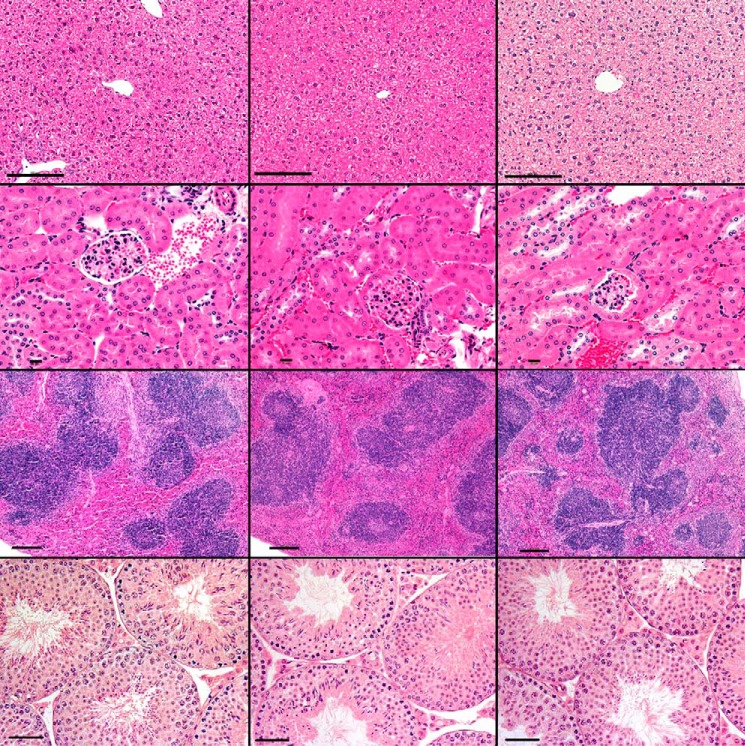
Figure 3.
Hematoxylin and eosin (H&E)-stained representative images of the liver (top row, ×200 original magnification; bar, 100 μm); kidney (2nd row, ×400 original magnification; bar, 10 μm); spleen (3rd row, ×100 original magnification; bar, 100 μm); and testis (bottom row, ×200 original magnification; bar, 50 μm) from Cyp26a1+/+ (left), Cyp26a1+/− (middle), and Cyp26a1−/− (right) male mice.

