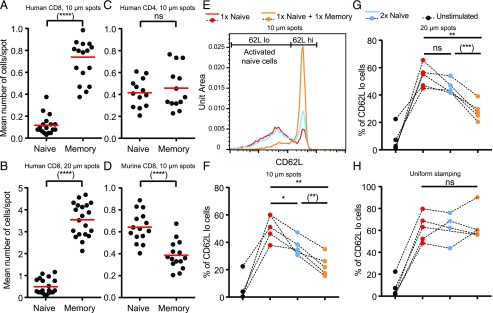
FIGURE 3.
CD8+ hTm cells compete out naive T cells by preventing access to stimulatory spots because of high SP. (A–D) “1×” number (see Materials and Methods) of differentially labeled naive and memory cells were pooled and introduced into the channel with stimulatory spots. After 2 h, multiple fields along the channel were imaged for multiple donors. Mean number of cells attached per spot is plotted for each field: human CD8 T cells in (A) and (B), human CD4 T cells in (C), and murine CD8 T cells in (D). Mean value is shown in red. (E) Activation of human naive CD8 T cells assessed after 10–12 h of interaction with 10-μm stimulatory spots in a competitive setting by staining for CD62L. Having “2×” number of naive cells is a control case (blue) to compare against the scenario in which memory cells are also present (orange). Note that the histograms have the same number of naive cells represented. (F–H) Percentage of activated naive CD8 T cells, as measured by the percentage of cells with lower CD62L, under different competitive settings on 10-μm spots (F), 20-μm spots (G), and uniformly stamped surface (H). Lines that join the dots for each competitive setting represent the same donor. Data points for each competitive setting are color-coded [see top of (E) and (G)]. “1×” number of cells on 20-μm spots is considerably higher (see Materials and Methods). Channels with uniformly stamped surface received the same number of cells as the channels with 10-μm spots under the corresponding competitive settings. Each data point represents a separate donor and independent experiment in each plot. *p < 0.05, **p < 0.01, ***p < 0.001, ****p < 0.0001.

