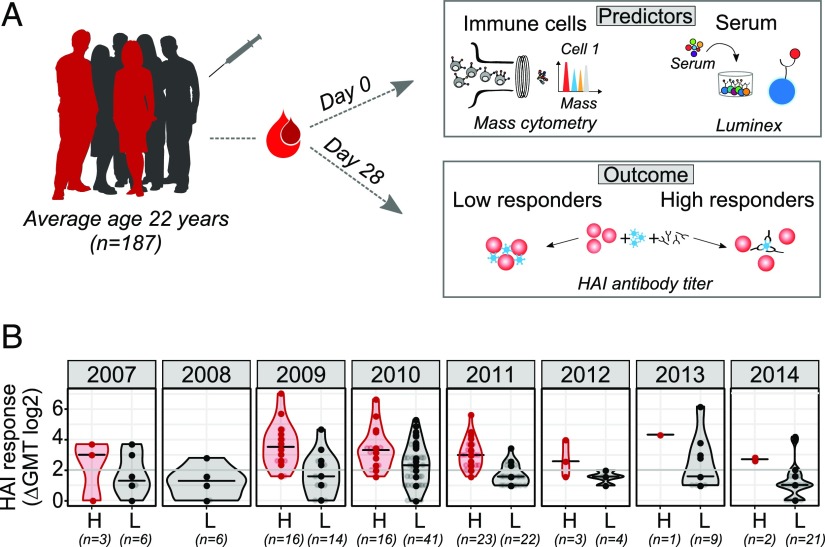
FIGURE 1.
Study design. (A) One hundred eighty-seven healthy donors (average age 22 y, range 8–40 y of age) were recruited across eight consecutive influenza seasons. Data acquired at the baseline (day 0) included phenotypical and functional state (phosphorylated proteins) of immune cells analyzed using flow or mass cytometry and serum analysis using Luminex assay. Individuals were labeled as high or low responders, depending on the HAI Ab titers determined on day 28 after vaccination. (B) HAI Ab responses to influenza vaccine strains in high (H, red) and low (L, gray) responders across years. Numbers below x-axis indicate the number of donors in each group. HAI responses are shown as GeoMean titer (GMT) calculated as a fold change between day 0 and day 28 after vaccination for all vaccine strains. Violin plots show distribution of individuals. The line shows the median. Seroconversion is defined as 4-fold increase in HAI titer for all vaccine strains (denoted by a gray line).

