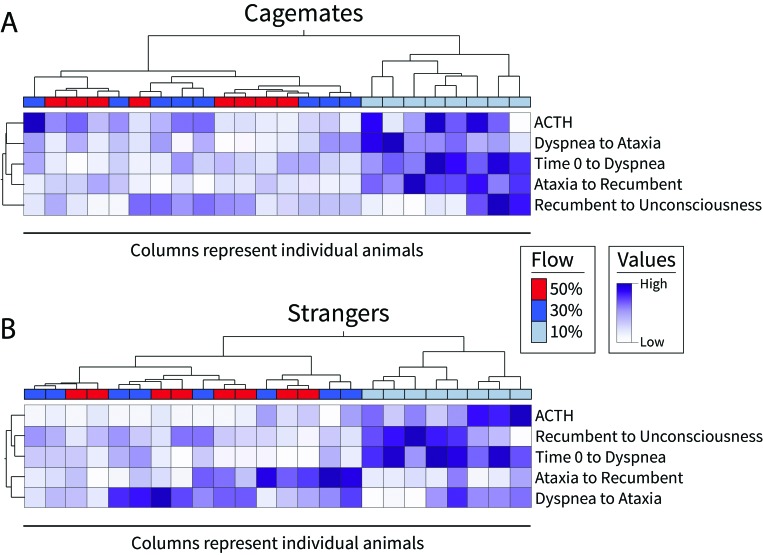
Figure 3.
Mice in the 10% v/min group have a different structure of the observed stages of exposure to CO2 and the level of ACTH. Heat map showing scaled values for the various stages of exposure to CO2 and the plasma level of ACTH (pg/mL). The flow rate of each animal is depicted as a horizontal bar at the top of the heatmap. Mice (shown as columns) and variables (shown as rows) were clustered by using unsupervised hierarchical clustering (Ward method).

