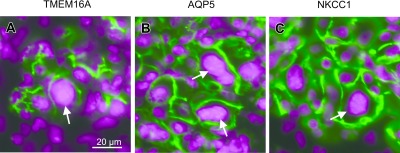
Fig. 10.

Immunofluorescence localization of TMEM16A, AQP5, and NKCC1 in abnormal cells. Sections from IRD parotid glands were fluorescently labeled. Fluorescence images of TMEM16A, AQP5, and NKCC1 shown in green are merged with those for DAPI in magenta. Abnormally enlarged parotid acinar cells with enlarged nuclei are indicated by arrows.
