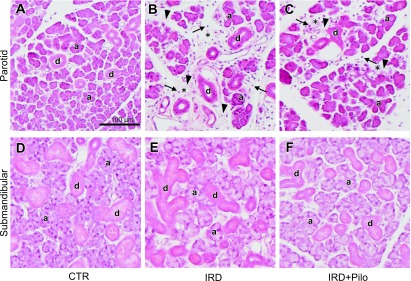
Fig. 3.
Hematoxylin-eosin staining. Typical images of the parotid (A, B, and C) and submandibular (D, E, and F) glands from each group are shown. Some of acini and ducts are indicated by “a” and “d”, respectively. Mononuclear infiltrates and increased interstitial fibers in increased interstitial spaces (asterisks) are indicated by arrows and arrowheads, respectively, in B and C.

