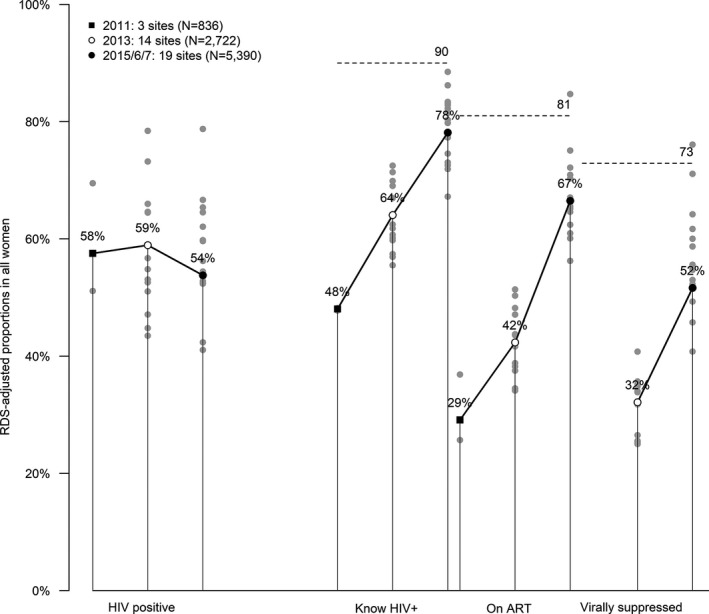
Figure 3.

Engagement of female sex workers in the HIV care cascade 2011, 2013, 2015/6/17. The treatment cascades for the three time point arms are illustrated, with the left of each bar showing results for 2011, the middle for 2013 and the right 2016. The cascades are shown for all women included in the relevant surveys, with the 90:90:90 targets indicated with horizontal dotted lines. All values were adjusted with RDS‐II. The dots represent the value of cascade indicator for each site surveyed in that year.
