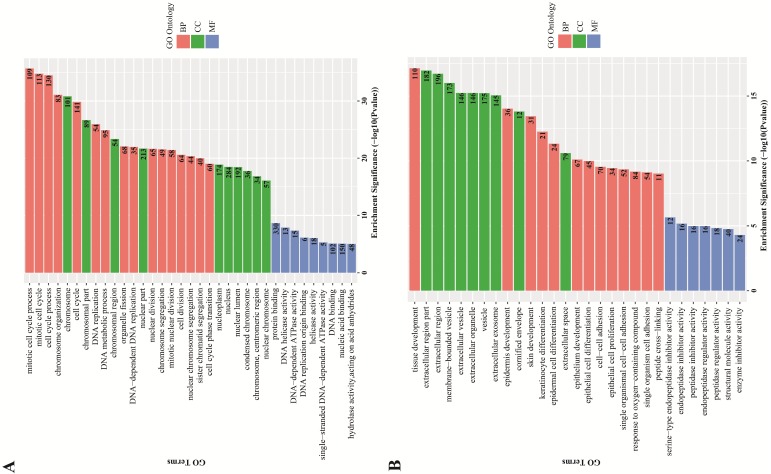
Figure 3.
GO terms enrichment analysis of DEGs. Red: biological process; Green: cellular component; Blue: molecular function. Number in the bar plot: Count of DEGs enriched in corresponding GO classification. (A) GO analysis results of up-regulated DEGs, which were significantly enriched in cell cycle, cell nucleus and DNA replication-associated enzyme activity; (B) GO analysis results of down-regulated DEGs, which were significantly enriched in tissue development and cell differentiation, extracellular region and peptidase inhibitor activity.

