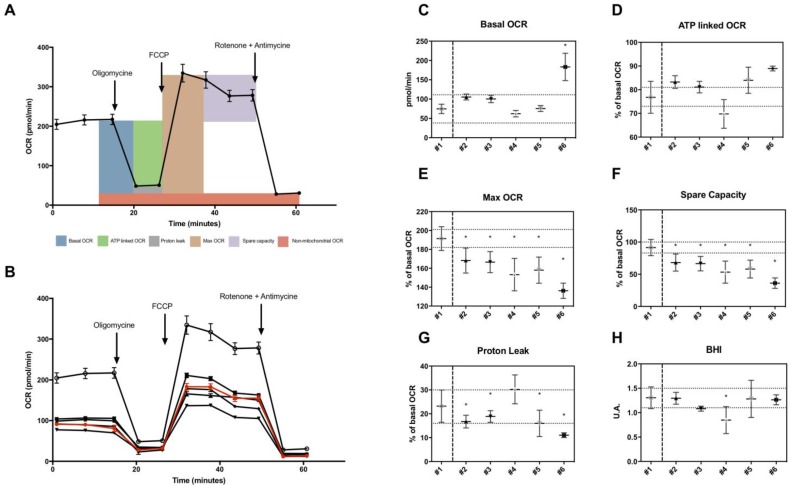
Figure 2.
Microscale oxygraphy in skin fibroblasts from patients. A, General scheme of OCR measurement under basal conditions followed by the sequential addition of oligomycin, FCCP and rotenone plus antimycin A, as indicated. Each data point represents an OCR measurement (mean +/- SD; n> 10). B, OCR profile in studied fibroblasts. All patients are represented in black, control appears in red. Each data point represents an OCR measurement (mean +/- SD; n> 10). C, Basal OCR in pmol/min. D-G, ATP-linked, maximal, spare capacity and proton leak linked OCR as a percentage of basal OCR. Dotted lines represent estimated variation range within the control (coefficient of variation as calculated in reproducibility test). H, Bioenergetic Health index in arbitrary units. Healthy control is #1 and patients #2 to #6. The asterisk indicates the ratios which significantly differ (p < 0.05) between the control patient and fibroblast cultures from patients with mitochondrial cytopathy. Mean +/- SD.

