Figure 8.
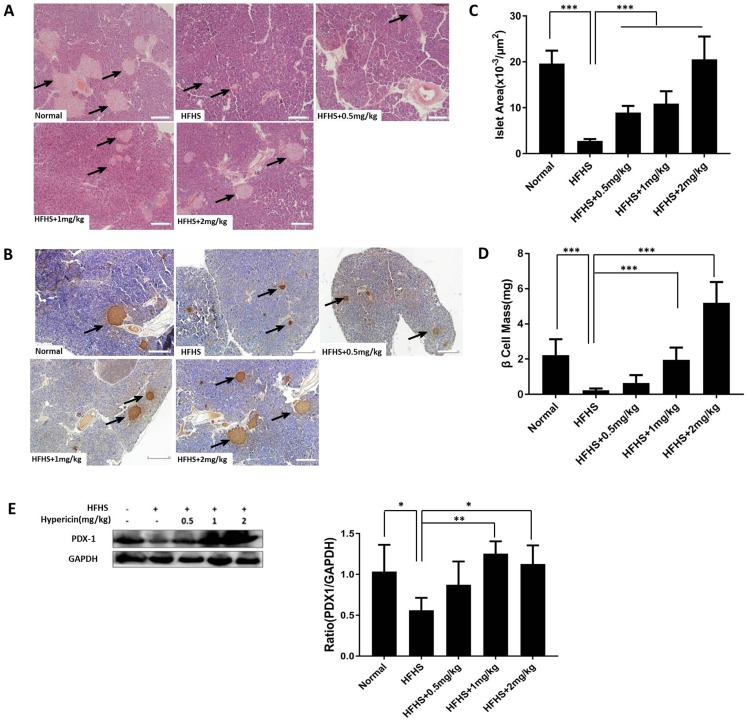
Therapeutic use of hypericin decreases β-cell loss and maintains islet mass in mice with HFHS-induced diabetes. (A) Histological sections of mouse pancreatic tissue. The mice in Fig. 7 were sacrificed, and the pancreases were removed and weighed. Portions of the mouse pancreases were fixed and subjected to HE staining as in Fig. 5A. Scale bar represents 100 μm. Arrows indicate pancreatic islets. (B-D) Fixed pancreas tissue from A was subjected to IHC analysis using anti-C-peptide antibodies (B) as shown in Fig. 5B, after which IHC-stained pancreatic sections were used to calculate the islet area (C) and β-cell mass (D) of the pancreas. The scale bar represents 100 μm. Arrows indicate positively stained cells. Data are presented as the mean ± S.D. (n = 8). (E) PDX1 protein levels in the mouse pancreas. Portions of the mouse pancreases from (A) were homogenized. PDX1 levels in the homogenate were detected by Western blot, and the density ratios of PDX1 to GAPDH were measured as in Fig. 5E. Fold change relative to the normal group is shown in the right-hand panel. Data are presented as the mean ± S.D. (n = 6). *p<0.05, **p<0.01 ***p<0.001, versus the HFHS group.

