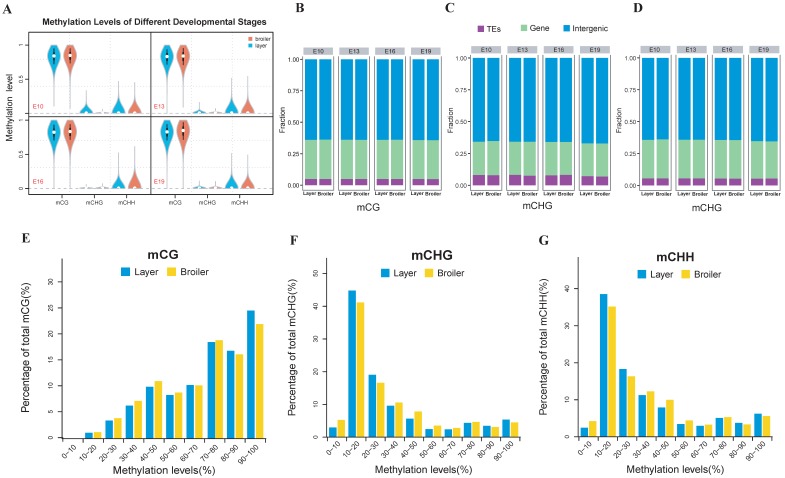
Fig 1.
Genome-wide profiles of DNA methylation among different sample groups. (A) Genomic methylation levels in either layers or broilers at E10, E13, E16 and E19, respectively. Methylation level were range from 0 to 1. (B-D) Proportion of methylated CpG located in different genomic features at different developmental stages and in CG, CHG and CHH contexts, respectively. (E-G) The methylation levels of methylated CpG sites were equally divided into 10 intervals and the percentage of each interval was measured using E10 as an example. The mCG, mCHG and mCHH represent the methylated CpG sites in CG, CHG and CHH contexts, respectively.

