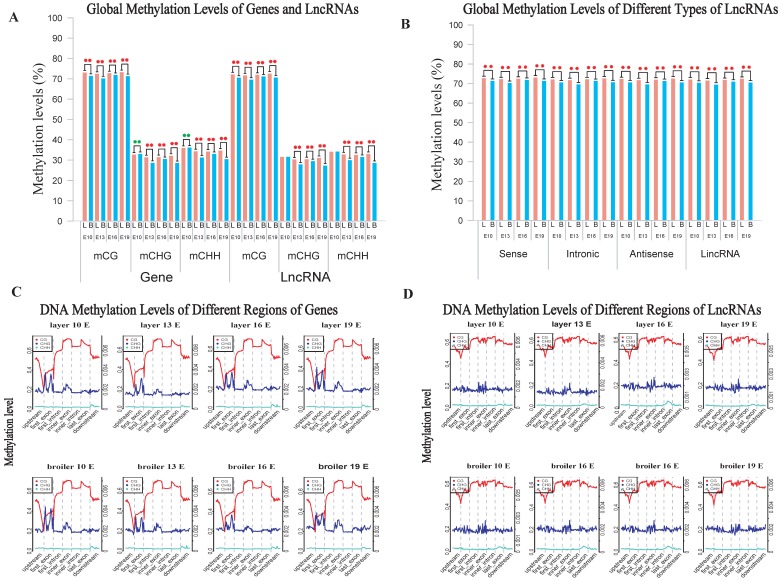
Fig 2.
Comparative measurement of methylation level of genes and lncRNA. (A) Comparison of methylation levels of genes or lncRNAs between layers and broilers in 3 different contexts. (B) Measurement of methylation level of different types of lncRNAs. The 'L' and 'B' in the figures represents the layers and the broilers, respectively. * P <0.05, ** P <0.01 for comparison between two chicken lines. The red star means the methylation level of layers is significantly higher than broilers whereas the green star represents an opposite result. (C, D) Genomic methylation around genes and lncRNAs were measured across the genome, respectively. Genes or lncRNAs were separated into 7 regions (upstream, first exon, first intron, inner exon, inner intron, last exon and downstream) and each region was equally divided into 20 bins for calculation and visualization.

