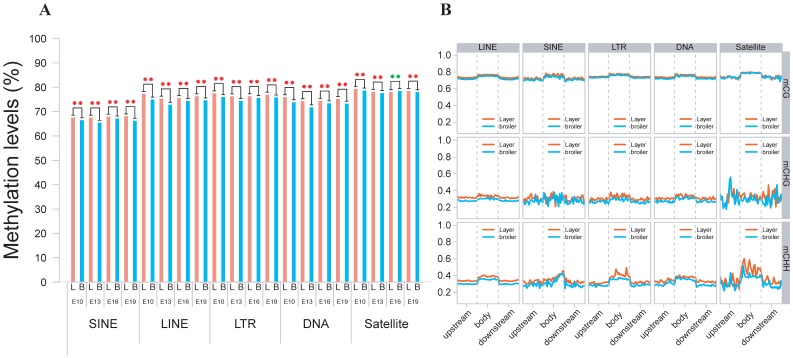
Fig 3.
Methylation levels of different types of TEs using E19 as an example. (A) Comparative measurement of methylation levels of SINE, LINE, LTR, DNA and Satellite regions between two chicken lines in CG context. (B) Methylation of different types of TEs for upstream, body and downstream regions in 3 different contexts using 20 bins across the whole genome.

