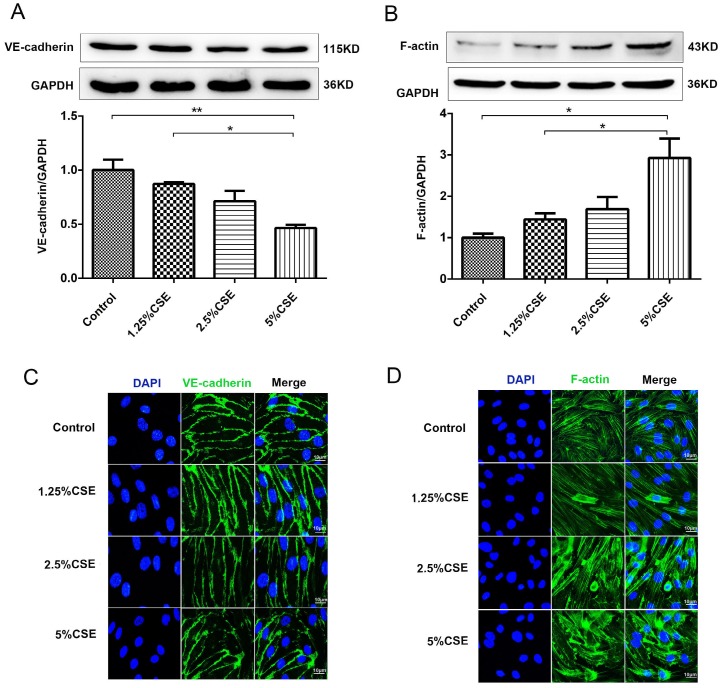
Figure 1.
The effect of CSE on the expression of VE-cadherin and the actin cytoskeleton in HUVECs. (A) The expression levels of the VE-cadherin and (B) F-actin in cell lysates from HUVECs were detected by Western blotting. Expression of VE-cadherin (C) and F-actin (D) in HUVECs after CSE treatment was analyzed by immunofluorescent staining. Scale bar is 10μm. Green indicates cells labeled with F-actin and VE-cadherin; blue, DAPI. All data were compared with control group and presented as mean ±SEM (n=5 in each group), *P < 0.05, **P < 0.01.

