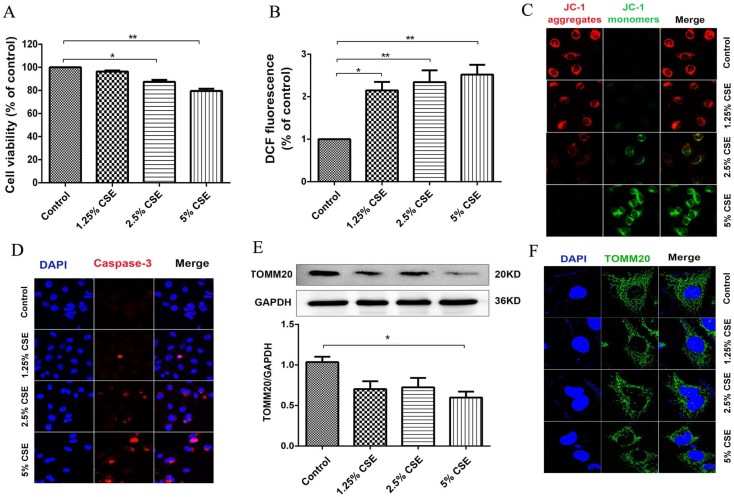
Figure 3.
CSE caused mitochondrial dysfunction in HUVECs. (A) HUVECs were incubated with CSE at different concentration for 24h. The cell viability was measured by CCK8 kit. (B) Reactive oxygen species levels were analyzed by DCFH-DA kit. (C) After treatment the cells were subjected JC-1 staining (400×) for mitochondrial membrane potential assessment. Red staining indicates polarized mitochondria in JC-1 staining. Green staining indicates depolarized mitochondria in JC-1 staining. (D) Immunofluorescence staining for caspase-3 (red) and nuclei (blue) (400×). (E) Expression of protein TOMM20 in HUVECs was shown by Western blotting. GAPDH served as the standards. (F) Representative mitochondrial morphology (1000×) in HUVECs incubated for 24h with CSE. Blue: DAPI; green: TOMM20 (mitochondria). All data were compared with control group and presented as mean ±SEM (n=5 in each group), *P < 0.05, **P < 0.01.

