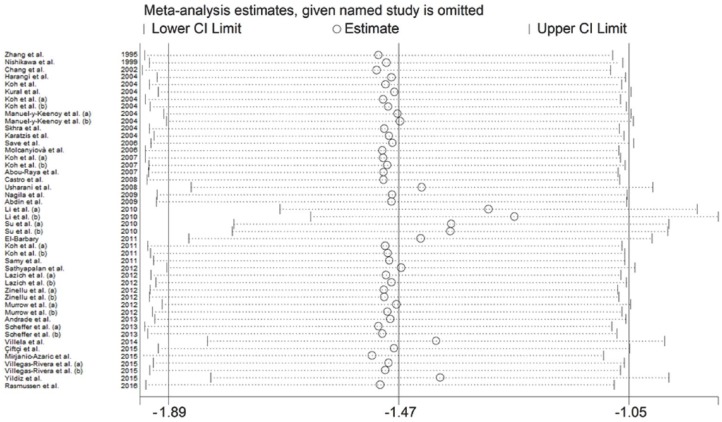
Figure 3.
Sensitivity analysis of the association between MDA and statin treatment. The influence of individual studies on the overall SMD is shown. The middle vertical axis indicates the overall SMD and the two vertical axes indicate the 95% CIs. Hollow circles represent the pooled SMD when the remaining study is omitted from the meta-analysis. The two ends of each broken line represent the 95% CI.
CI, confidence interval; MDA, malondialdehyde; SD, standard deviation; SMD, standardized mean difference.

