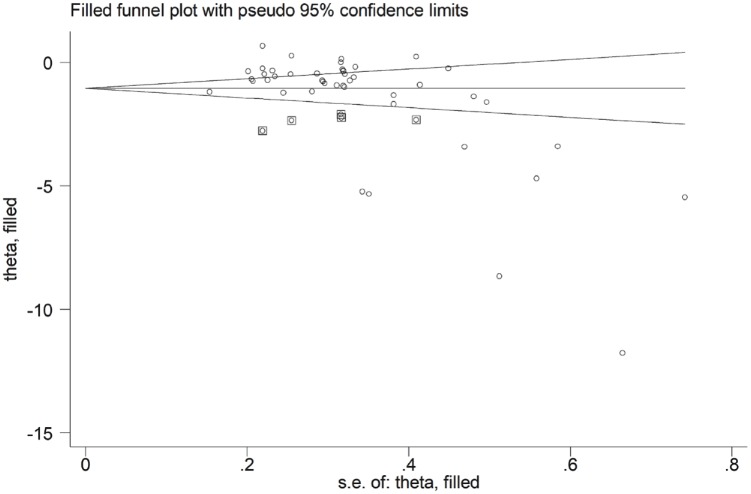
Figure 4.
Funnel plot of studies investigating MDA concentrations (at baseline and after statin treatment) after trimming and filling. Dummy studies and genuine studies are represented by enclosed circles and free circles, respectively.
CI, confidence interval; MDA, malondialdehyde; se, standard error.

